Berita & analisis pasar
Tetap selangkah lebih maju di pasar dengan wawasan ahli, berita, dan analisis teknikal untuk memandu keputusan trading Anda.

Pengumuman gencatan senjata 8 April dan diskusi paralel seputar gencatan senjata 45 hari belum menyelesaikan gangguan Selat Hormuz. Mereka, untuk saat ini, membatasi skenario terburuk, tetapi lalu lintas tanker tetap pada sebagian kecil dari tingkat normal dan permintaan Iran untuk biaya transit menandakan perubahan struktural, bukan yang sementara.
Apa yang dimulai sebagai konflik regional telah menjadi kejutan energi global, dan pertanyaan bagi pasar bukan lagi apakah Hormuz terganggu, tetapi seberapa permanen gangguan itu mengubah dasar harga untuk minyak.
Kuncinya yang menarik
- Sekitar 20 juta barel per hari (bpd) minyak dan produk minyak bumi biasanya melewati Selat Hormuz antara Iran dan Oman, setara dengan sekitar seperlima dari konsumsi minyak global dan sekitar 30% dari perdagangan minyak laut global.
- Ini adalah kejutan aliran, bukan masalah inventaris. Pasar minyak bergantung pada throughput berkelanjutan, bukan penyimpanan statis.
- Jika gangguan berlanjut lebih dari beberapa minggu, Brent dapat bergeser dari lonjakan jangka pendek ke guncangan harga yang lebih luas, dengan risiko stagflasi.
- Lalu lintas kapal tanker melalui selat turun dari sekitar 135 kapal per hari menjadi kurang dari 15 kapal pada puncak gangguan, pengurangan sekitar 85%, dengan lebih dari 150 kapal berlabuh, dialihkan, atau tertunda.
- Gencatan senjata dua minggu diumumkan pada 8 April, dengan negosiasi gencatan senjata selama 45 hari sedang berlangsung. Iran secara terpisah telah mengisyaratkan permintaan biaya transit pada kapal-kapal yang menggunakan selat, yang, jika diformalkan, akan mewakili dasar geopolitik permanen pada biaya energi.
- Pasar telah mulai berputar menjauh dari pertumbuhan dan eksposur teknologi terhadap nama energi dan pertahanan, mencerminkan pandangan bahwa kenaikan minyak menjadi biaya struktural daripada premi risiko sementara.
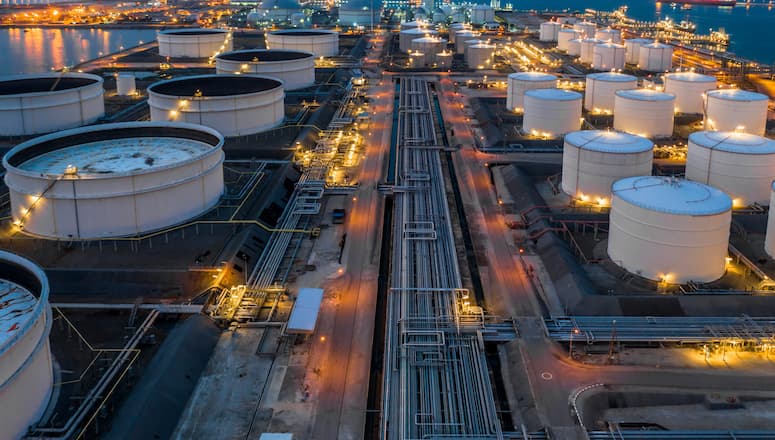
Titik Chokepoint Minyak Paling Kritis di Dunia
Selat Hormuz menangani sekitar 20 juta barel per hari minyak dan produk minyak bumi, setara dengan sekitar 20% dari konsumsi minyak global dan sekitar 30% dari perdagangan minyak laut global. Dengan permintaan minyak global mendekati 104 juta barel per hari dan kapasitas cadangan terbatas, pasar sudah seimbang sebelum eskalasi terbaru.
Selat ini juga merupakan koridor penting untuk gas alam cair. Sekitar 290 juta meter kubik LNG transit setiap hari rata-rata pada tahun 2024, mewakili sekitar 20% dari perdagangan LNG global, dengan pasar Asia sebagai tujuan utama.
Badan Energi Internasional (IEA) telah menggambarkan Hormuz sebagai titik henti transit minyak yang paling penting di dunia, mencatat bahwa bahkan gangguan sebagian dapat memicu pergerakan harga yang terlalu besar. Minyak mentah Brent telah bergerak di atas US $100 per barel, mencerminkan keketatan fisik dan kenaikan premi risiko geopolitik.

Kapal tanker menganggur karena aliran lambat
Data pengiriman dan asuransi sekarang menunjukkan ketegangan secara real time. Lebih dari 85 kapal induk minyak mentah besar dilaporkan terdampar di Teluk Persia, sementara lebih dari 150 kapal telah berlabuh, dialihkan atau ditunda karena operator menilai kembali keselamatan dan asuransi. Itu akan meninggalkan sekitar 120 juta hingga 150 juta barel minyak mentah menganggur di laut.
Volume tersebut hanya mewakili enam hingga tujuh hari throughput Hormuz normal, atau sedikit lebih dari satu hari konsumsi minyak global.
Data pengiriman dan asuransi yang diperbarui sekarang mengkonfirmasi lebih dari 150 kapal telah berlabuh, dialihkan, atau tertunda, naik dari 85 yang awalnya dilaporkan. Cakupan konsumsi global 1,3 hari dari minyak mentah yang tidak digunakan tetap menjadi kendala yang mengikat: ini adalah kejutan aliran, bukan masalah penyimpanan, dan gencatan senjata belum diterjemahkan ke dalam throughput yang dipulihkan secara bermakna.
Pasar yang dibangun di atas aliran, bukan penyimpanan
Pasar minyak berfungsi pada pergerakan terus menerus. Kilang, pabrik petrokimia, dan rantai pasokan global dikalibrasi untuk pengiriman yang stabil di sepanjang jalur laut yang dapat diprediksi. Ketika aliran melalui titik henti yang membawa sekitar seperlima dari konsumsi minyak global dan sekitar 30% dari perdagangan minyak laut global terganggu, sistem dapat bergerak dari keseimbangan ke defisit dalam beberapa hari.
Kapasitas produksi cadangan, sebagian besar terkonsentrasi di OPEC, diperkirakan hanya 3 juta hingga 5 juta barel per hari. Itu jauh di bawah volume yang berisiko jika aliran Hormuz sangat terganggu.
Oil market analysis
How long do idle tankers last?
135M idle barrels — days of cover against each demand benchmark

vs. Strait of Hormuz daily flow (20M bbl/day)
vs. Global oil consumption (104M bbl/day)
vs. US Strategic Petroleum Reserve release (1M bbl/day)
135M
idle barrels on tankers (midpoint of 120–150M range)
~33%
of daily Hormuz flow that is idle storage, not transit
<31 hrs
is all idle storage against global daily consumption
Risiko inflasi dan limpahan makro
Dampak inflasi dari kejutan minyak biasanya datang dalam gelombang. Harga bahan bakar dan energi yang lebih tinggi dapat mengangkat inflasi utama dengan cepat karena biaya bensin, solar, dan listrik bergerak lebih tinggi.
Seiring waktu, biaya energi yang lebih tinggi dapat melewati pengiriman, makanan, manufaktur, dan layanan. Jika gangguan berlanjut, kombinasi peningkatan inflasi dan pertumbuhan yang lebih lambat dapat meningkatkan risiko lingkungan stagflasi dan membuat bank sentral menghadapi pertukaran yang sulit.
Tidak ada offset yang mudah, sistem dengan sedikit kelonggaran
Apa yang membuat episode saat ini sangat akut adalah kurangnya kelonggaran dalam sistem global.
Pasokan dan permintaan global mendekati 103 juta hingga 104 juta barel per hari meninggalkan sedikit bantalan cadangan ketika chokepoint penanganan hampir 20 juta barel per hari, atau sekitar seperlima dari konsumsi minyak global, terganggu. Diperkirakan kapasitas cadangan 3 juta hingga 5 juta barel per hari, sebagian besar di dalam OPEC, hanya akan mencakup sebagian kecil dari volume yang berisiko.
Rute alternatif, termasuk jaringan pipa yang melewati Hormuz dan mengalihkan rute pengiriman, hanya dapat mengimbangi sebagian arus yang hilang, dan biasanya dengan biaya yang lebih tinggi dan dengan waktu tunggu yang lebih lama.
Intinya
Sampai transit melalui Selat Hormuz dipulihkan dan dipandang aman secara kredibel, aliran minyak global kemungkinan akan tetap terganggu dan premi risiko meningkat. Bagi investor, pembuat kebijakan dan pembuat keputusan perusahaan, pertanyaan intinya adalah apakah minyak dapat bergerak ke tempat yang seharusnya, setiap hari, tanpa gangguan.


Mastercard Inc. (NYSE: MA) announced the latest financial results for the previous quarter before the market open on Thursday. World’s third largest financial services company beat both revenue and earnings per share (EPS) estimates for Q4 2022. The company reported revenue of $5.817 billion vs. $5.793 billion estimate.
EPS at $2.65 per share in Q4 vs. $2.575 per share expected. CEO commentary ''We closed out the year with strong financial results and notable wins which will help us capitalize on the tremendous secular shift to digital payments,'' Michael Miebach, CEO of the company said in a press release. ''As we look at the broader economy, we see the continued recovery of cross-border travel, with volumes up 59% versus a year ago and we’re encouraged by Asia opening up further. While macroeconomic and geopolitical uncertainty persists, consumer spending has been remarkably resilient.
We are well prepared to adjust our investment profile quickly if needed,'' Miebach concluded. Stock reaction Share price of Mastercard dipped by around 2% on Thursday, trading at around $374 a share. Stock performance 1 month: +7.91% 3 months: +17.65% Year-to-date: +8.06% 1 year: +7.19% Mastercard stock price targets Baird: $410 Barclays: $427 Truist Securities: $450 Jefferies: $430 Keybanc: $425 UBS: $441 Wells Fargo: $405 Mizuho: $380 Morgan Stanley: $437 Mastercard is the 19 th largest company in the world with a market cap of $363.31 billion.
You can trade Mastercard Inc. (NYSE: MA) and many other stocks from the NYSE, NASDAQ, HKEX, ASX, LSE and DE with GO Markets as a Share CFD. Sources: Mastercard Inc., TradingView, MarketWatch, MetaTrader 5, Benzinga, CompaniesMarketCap

Microsoft Corporation (NASDAQ: MSFT) reported the latest financial results on Wall Street after the market close on Tuesday. Let’s take a closer look at the results. The US technology giant reported revenue of $52.747 billion for quarter ending on December 31, 2022 (up by 2% year-over-year), narrowly falling short of $52.987 billion revenue expected.
Earnings per share (EPS) reported at $2.32 per share (down 6% year-over-year) vs. $2.293 per share estimate. CEO and CFO commentary ''The next major wave of computing is being born, as the Microsoft Cloud turns the world’s most advanced AI models into a new computing platform,'' CEO of Microsoft, Satya Nadella looked into the future of the company. ''We are committed to helping our customers use our platforms and tools to do more with less today and innovate for the future in the new era of AI,'' Nadella concluded. Amy Hood, CFO: ''We are focused on operational excellence as we continue to invest to drive growth.
Microsoft Cloud revenue was $27.1 billion, up 22% (up 29% in constant currency) year-over-year as our commercial offerings continue to drive value for our customers.'' Stock reaction Shares of Microsoft were down by 0.22% at market close on Tuesday, trading at $241.56 a share. The stock was up by around 4% in the after-hours. Stock performance 1 month: +2.14% 3 months: -3.44% Year-to-date: +0.93% 1 year: -16.10% Microsoft stock price targets High: $365.00 Median: $280.00 Low: $212.00 Average: $284.76 Microsoft is the 3 rd largest company in the world with a market cap of $1.804 trillion.
You can trade Microsoft Corporation (NASDAQ: MSFT) and many other stocks from the NYSE, NASDAQ, HKEX, ASX, LSE and DE with GO Markets as a Share CFD. Sources: Microsoft Corporation, TradingView, MarketWatch, MetaTrader 5, WSJ, CompaniesMarketCap
Ethereum and its big brother Bitcoin, have seen one of their most momentous moves since their peaks in November 2021. Various sector wide catalysts worked to move the price down including the collapse of Celsius and FTX which caused shockwaves to the cryptocurrency community. Inflationary pressures also left growth assets reeling in losses, leaving Ethereum beaten down over the last 12 months.
However, there are some signs that it might be starting to turn. From a broader economic perspective there is hope that the Federal Reserve will pivot from its aggressive rate hiking policy to avoid a potential recession which has led to a recent revival of growth assets including cryptocurrency. From a technical perspective the weekly price chart shows a clear head and shoulders pattern that has played out.
The question is whether sell down has finished or if there is further misery to come. The price has seen its range become tighter as it has struggled to break below the key support at $1050. This area also acts as the 200-week moving average adding to its supply.
The volume and volatility have also been reducing as the price has approached this level. The RSI is showing an interesting signal. The RSI has begun trending up which is diverging with the actual price action.
This may indicate that the price is ready to move to the upside in the short term. The 50-week moving average is plateauing indicating that the price is facing some strong support. On the daily chart, the price looks to be coiling with both the 50 day and 200 day moving averages trending up for the first time since before the price peaked in 2021.
Furthermore, it is possible that the 50-day moving average will cross through the 200-day moving average which is very bullish move. The price has also broken above both daily moving averages and may be looking to test the next resistance at $2030. This is also roughly the same price of the neckline of the underlying head and shoulders pattern.
Therefore, a target of $2030 is a reasonable for a short-term long trade/ Ultimately, the price of Ethereum looks like it may be ready to reverse however, it is still at the mercy of the broader Cryptocurrency sector news and macroeconomic catalysts.
The price of Natural Gas has continued its drive back down after peaking in the middle of last year. The price has had an aggressive sell off after an equally aggressive run during the initial stages of the Russian and Ukraine conflict. This was due to Russian gas exports being banned and elevated inflation levels.
However, as the conflict has subsided the price of gas has returned to its seasonal trends. In addition, in recent weeks warmer weather has reduced the reliance on the energy source for much of Europe. The chart from a technical perspective is exceptionally bearish.
For the better part of a decade the price was ranging between 1.5 – 6.5. The aggressive move in 2022 as discussed was due to the beginning of the Russia and Ukraine crisis. The price since then looks to have made a head and shoulders pattern which is a bearish reversal pattern.
The neckline was at 5.5 and was broken through. The price has also broken down through the 200-day EMA on fairly aggressive volume. By zooming out, it can be seen that the recent sell off has been the price moving back into its long-term consistent range.
Therefore, the price should be nearing a bottom. As the price approaches 1.5/2 it may become a good opportunity for a long trade. An initial target at the top of the range of 6.6 could be a reasonable target for this medium-term swing trade.
The daily chart confirms this move and shows how the price has broken through the mid-level of support at 3.5. The daily chart also shows how the volume has been reducing significantly indicating some potential exhaustion in the short term and a spike in buying may be favorable for an upward thrust in price. Ultimately, the price of Gas could gain momentum if Europe’s winter brings about cooler weather or if China’s demand increases as it moves out of its Covid 19 restrictions increasing demand.
With volatility still high for the price of a natural gas caution should still be had when placing a trade.

The outlook for the Australian equities market is one of the best globally and is set up to cope with a potential recession. The Australian market showed itself to be robust in much of the volatility and downturn of last year being one of the more solid economies. This relative strength has carried so far into 2023 and has largely been due to the resource heavy nature of the ASX with most companies on the index being large resource and mining.
The XJO was also geographically protected from much of the geopolitical conflict in Europe that many European markets had to suffer through. The XJO is currently just 300 points off its all time high and with improving commodity prices it is well placed to weather a recessionary storm. A reopening of China may further support growth of the Australian market because growth in China may help various sectors such as travel, construction, manufacturing, and resources.
Lastly, as the Central banks across the world look at lowering interest rates it will only help growth economies such as Australia. Risk assets such as the Technology sector and growth economies should benefit as the cost of borrowing comes down. Although Banks will have to balance the need to lower rates with the need to tame inflation and the fight between which is a worse evil to fight will be much of the talking point of 2023.
Technical Analysis As stated above the XJO is currently just about 300 points below its all-time highs and is trending towards that target. Firstly, on the weekly chart the XJO has been able to maintain a tight range over the last 2 years. Once the dust had settled after the Covid 19 pandemic the price developed a range between 6412 and 7634.
The price also bounced of 6412 its long-term support twice in 2022 before pushing higher. Importantly, since October 2022, the XJO has been able to stay above the 50-week moving average as it has gained momentum. On the daily chart the price has broken to level not seen since April 2022.
Therefore, it is likely that the price may face some significant resistance as it approached 7600. Another positive sign is that the short term 50 day moving average has crossed back over the longer term 200 day moving average. This indicates that momentum is beginning to shift towards the bulls.
With more information still to come out, the Australian equities market is as well placed as any to deal with any potential macroeconomic factors that come its way.

TSMC posts strong Q4 results – the stock is rising Taiwan Semiconductor Manufacturing Company Limited (NYSE: TSM) reported Q4 financial results before the market open in the US on Thursday. The Taiwanese company reported revenue of $20.554 billion for Q4, falling slightly short of Wall Street estimate of $20.574 billion. TSMC reported earnings per share (EPS) of $1.875% for the quarter, higher than $1.795 EPS expected.
CFO commentary ''Our fourth quarter business was dampened by end market demand softness, and customers’ inventory adjustment, despite the continued ramp-up for our industry-leading 5nm technologies,'' Wendell Huang, VP and CFO said after the results. ''Moving into first quarter 2023, as overall macroeconomic conditions remain weak, we expect our business to be further impacted by continued end market demand softness, and customers’ further inventory adjustment,'' Huang looked ahead. The company expects the revenue of between $16.7 billion and $17.5 billion for Q1. Stock reaction Shares of TSMC were up by over 7% on Thursday at $88.07 a share.
Stock performance 1 month: 3 months: Year-to-date: 1 year: TSMC price targets Susquehanna: $88 Atlantic Equities: $170 Cowen & Co.: $120 Argus Research: $150 Goldman Sachs: $55 Taiwan Semiconductor Manufacturing Company Limited is the 10 th largest company in the world with a market cap of $454.97 billion. You can trade Taiwan Semiconductor Manufacturing Company Limited (NYSE: TSM) and many other stocks from the NYSE, NASDAQ, HKEX, ASX, LSE and DE with GO Markets as a Share CFD. Sources: Taiwan Semiconductor Manufacturing Company Limited, TradingView, MarketWatch, MetaTrader 5, Benzinga, CompaniesMarketCap