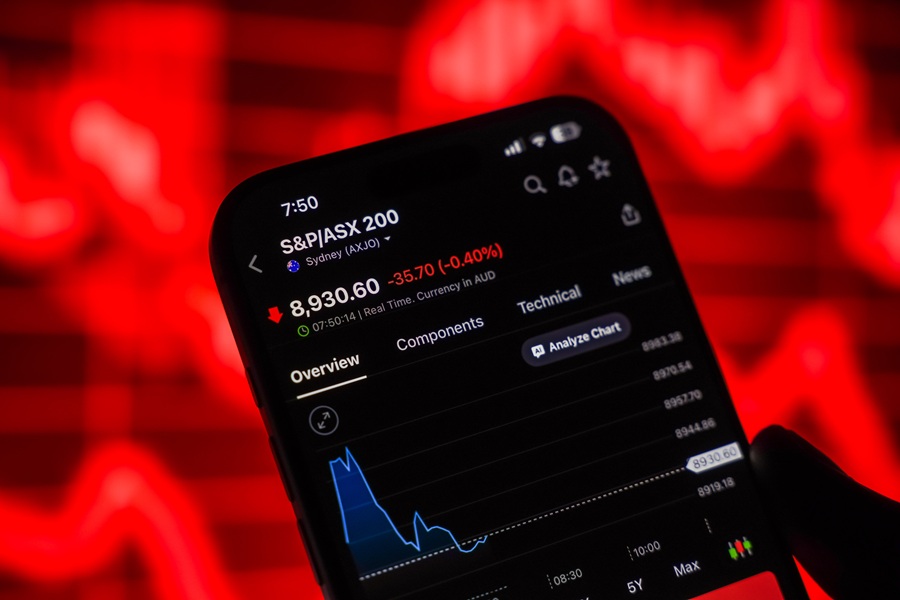
Most traders assume a country's stock index perfectly reflects the health of that country's broader economy. For the ASX 200, that assumption breaks down fast.
Almost a third of the index is composed of banks, and another massive share belongs to mining companies whose fortunes depend heavily on a country on the other side of the world. The ASX 200 is less a picture of how Australia is doing holistically, and more a picture of how Australian banks are performing and how much China wants to buy from Australian miners. Understanding that distinction changes how you read every single ASX 200 move.
What the ASX 200 actually is
The ASX 200 measures the performance of the 200 largest companies listed on the Australian Securities Exchange. It is weighted by market capitalisation, meaning the largest companies have the most influence over the index's total value.
Retail traders typically access it through CFDs, often labelled as AUS200, or via ETFs and index futures. However, while the mathematical structure is similar to its US counterparts, the types of companies that sit at the top of the Australian index make it a fundamentally different beast.
Composition
200 largest ASX companies
Tracks top publicly listed companies in Australia, weighted heavily by market capitalisation toward major financials and resource miners.
AUSTRALIAN BENCHMARK
Access Methods
CFDs, ETFs & Futures
Traded via CFDs (AUS200), domestic index ETFs, or ASX index futures contracts for liquid long and short positioning.
TRADABLE INSTRUMENTS
Why banks and miners dominate the index
The defining structural reality of the ASX 200 is severe sector concentration. Financials and materials together make up the substantial majority of the index by weight. It is, in practice, a concentrated bet on just two sectors.
Financials (banks)
~30.8% weight
Materials (miners)
~21.4% weight
Healthcare
~9.2% weight
Industrials
~6.5% weight
Other 7 sectors
~32.1% combined
Financials (30.8%)
Dominated by Australia's big four retail banks. Driven by domestic credit growth, housing market activity, net interest margins, and RBA monetary policy.
Educational disclaimer: Sector weights are approximate representations for illustrative and educational purposes only.
Australia's major banks are among the largest companies in the country by market capitalisation. Their performance is closely tied to domestic interest rate conditions, housing market strength, credit growth, and bad debt levels. Because they are so heavily weighted, when the banking sector moves significantly, it drags the entire index with it, almost regardless of what is happening in healthcare, technology, or consumer goods.
Similarly, Australia is a major global exporter of resources. Its largest mining companies are massive components of the ASX 200. Their profitability is tied directly to global commodity prices, which gives the ASX 200 a massive, built-in exposure to international industrial demand.
Why China matters more than you'd expect
Because the materials sector is so dominant, Chinese economic data can often move the ASX 200 more aggressively than Australian domestic data.
China is the world's largest steel producer and Australia's largest trading partner. When China's manufacturing sector expands, or when the Chinese government announces major infrastructure stimulus or property sector support, demand for Australian iron ore surges. This drives up global commodity prices, which directly boosts the earnings outlook for the ASX 200's largest mining companies.
Conversely, when the Chinese property sector faces stress or manufacturing slows, iron ore prices drop, and the Australian mining sector sells off. This direct demand mechanism is why offshore data is so critical to the local index.
Why the ASX often follows the US overnight
The ASX 200 typically opens with a strong reference to how US markets performed overnight. Because the overnight US session closes before the Australian session opens, the ASX 200 frequently gaps at the open in the exact same direction as the US overnight move.
This gap happens as the market prices in the global risk sentiment changes that occurred while Australia was asleep. During the local session, the market then processes its own domestic news, and that initial gap is either confirmed, extended, or reversed.
What moves the ASX 200
The ASX 200 is driven by four primary forces spanning domestic credit, offshore commodity demand, and global sentiment leads.
4 core drivers of the ASX 200
Tends to rise when...
Banks report strong profits, bad debts remain low, credit growth is healthy, and rate conditions support lending margins.
Tends to fall when...
Banks face rising bad debts, credit growth slows, regulatory pressure increases, or compressed margins hurt profitability.
Tends to rise when...
Iron ore and metal prices rise, driven by Chinese steel production, infrastructure stimulus, or property recovery.
Tends to fall when...
Iron ore prices fall due to weak Chinese manufacturing, property stress, or steel production cuts.
Tends to rise when...
The S&P 500 and Nasdaq close higher overnight, setting a positive global risk tone for the Australian open.
Tends to fall when...
US markets sell off overnight, prompting opening gap declines across local Australian equities.
Tends to rise when...
A weaker AUD boosts reported earnings for resource exporters when foreign revenue translates back to local currency.
Tends to fall when...
A stronger AUD pressures exporter earnings, although strong AUD moves often coincide with broader commodity rallies that support miners.