
市场资讯及洞察

石油市场习惯于在停止结算之前就看上去已经定下来了。这就是现在的设置。
随着伊朗周边冲突的加剧,霍尔木兹海峡的交通量急剧下降,越来越多的船只因关闭AIS或自动识别系统而陷入黑暗,这些信号通常显示船只在哪里移动。霍尔木兹不只是另一条航道。它是世界上最重要的能源阻塞点之一,因此,当能见度开始消失时,供应风险就会回到对话的中心。
为什么现在这很重要
这很重要,有两个原因。
头条新闻是一回事。市场影响是另一回事。石油不仅关乎有多少桶,还关系到这些桶能否流动,谁愿意为它们投保,买家准备等待多长时间,以及交易者认为他们需要在多大风险的基础上定价。
目前,有三件事同时发生冲突:航运中断、外交脆弱以及市场已经严重倾向于一个方向。这种组合可以使布伦特原油的走势比基本面本身通常所暗示的要快。
是什么推动了这一举动
1 供应能见度恶化
第一个驱动程序很简单。市场看得更少,这往往会让市场更加紧张。
通过霍尔木兹的过境量急剧下降,而越来越多的交通量涉及不再广播标准跟踪信号的船只。简而言之,正常通过重要走廊的船只越来越少,越来越多的活动也变得越来越难以追踪。这并不自动意味着供应即将崩溃。但这确实意味着不确定性正在上升。
2 伊朗的储存缓冲区可能有限
第二个驱动因素是伊朗的出口和储存限制。
陆上储存容量估计约为4000万桶,市场正在关注有人所说的16天红线。到那时,长期的出口中断可能会开始迫使减产,以避免对储油库造成损害。对于新读者来说,要点很简单。如果石油不能储存足够长的时间,问题可能不再是出口延迟,而是开始成为真正的供应问题。
3 定位可以放大移动
第三个驱动因素是定位,这只是市场简写,说明在下一步行动发生之前交易者已经如何进行设置。
在这种情况下,投机性原油头寸显得严重片面。这很重要,因为当市场向一个方向倾斜得太远时,触发急剧调整并不需要太多时间。新的地缘政治冲击可能迫使交易者迅速采取行动,而一旦开始,价格的上涨幅度可能会超过单纯基础新闻所能证明的合理性。
为什么市场在乎
石油冲击很少能在能源市场内得到控制。
较高的原油价格可能会开始出现在运费、制造业和家庭能源账单中。这意味着通货膨胀预期可能会再次开始攀升。各国央行已经在努力管理粘性通货膨胀和疲软增长之间的艰难平衡,因此石油价格上涨会使这项工作变得更加艰难。
这不仅仅是一个关于石油生产商获得提振的故事。当能源成本上升时,航空公司、运输公司和其他对燃料敏感的企业可能会迅速承受压力。如果石油价格上涨使通货膨胀保持强于预期,则更广泛的股市可能还必须重新考虑政策前景。
连锁反应远不止石油
还有一个货币角度,它不如最初出现的那么简单。
当原材料价格上涨时,与大宗商品挂钩的货币,例如澳元,通常会获得支撑。但是这种关系不是自动的。如果石油价格因为全球需求改善而攀升,那可能会有所帮助。如果由于地缘政治风险激增而攀升,则市场可能会转向避险模式,即使大宗商品价格上涨,这也可能打压澳元。
这就是让这种举动比乍一看更有趣的原因。同样的石油涨势可以支撑市场的一个部分,同时给另一部分带来压力。
框架中的资产和名称
布伦特原油仍然是广泛供应风险中最明显的解读。如果交易者想要最简洁的头条新闻表达,通常是他们首先看的地方。
- 埃克森美孚是画面中最明显的名字之一。油价上涨可以支撑已实现的销售价格和短期的盈利势头,尽管这从来都不像石油上涨、囤积那么简单。成本、生产结构和更广泛的情绪仍然很重要。
- NexTera Energy 又增加了一层。这个故事不仅仅是关于化石燃料的。当能源安全成为一个更大的问题时,国内电力弹性、电网投资和替代发电的理由也将得到加强。
- 澳元/美元是另一个值得关注的市场。澳大利亚与大宗商品周期密切相关,因此原材料价格走强有时可以支撑该货币。但是,如果市场对恐惧的反应大于对增长的反应,那么通常的顺风可能不会成立。
对于新读者来说,关键是石油走势不会以整齐的、可预测的线条在市场中传播。它们不均匀地向外波动,帮助某些资产,给其他资产施加压力,有时两者兼而有之。
可能会出什么问题
强烈的叙述与单向交易不同。
停火可以比预期更快地稳定航运。欧佩克+可以通过提高产量来抵消部分紧张局势。来自中国的需求数据可能会令人失望,将焦点转移到消费疲软而不是供应受限上。而且,如果地缘政治溢价消退,石油回落的速度可能比当前情绪所暗示的要快。
对于新读者来说,要点很简单。石油涨势可以是真实的,但不是永久性的。短期内,中断风险可能证明此举是合理的,然后如果这些风险缓解或需求疲软,则迅速逆转。
市场不再孤立地对石油进行定价。这是定价可见性、运输安全性以及供应中断蔓延到通货膨胀、货币和更广泛的风险情绪中的风险。
这就是为什么Hormuz很重要,即使对于从未自己交易过一桶原油的读者来说也是如此。

In the most recent meeting, the US Federal Reserve hiked rates by 25 basis points, as anticipated, to take interest rates in the US to 5.25%, slightly beyond the terminal rate of 5.1%. However, the US Dollar Index (DXY) fell to the key support level of 100.80 which was last reached in April and February 2023, following the release of the rate hike decision. The DXY trading lower was driven primarily due to comments from Chair Powell where he indicated that the Federal Reserve was “closer to the end than the beginning” and that it “felt like they are close, or even there”.
This signaled to the market that the Federal Reserve could pause on future rate hikes, leading to the weakness seen on the DXY. In the lead-up to the Federal Reserve rate decision, the upside on the DXY was limited by the round number resistance area of 102 and the 200-period moving average (200 MA). With the DXY approaching the key support level of 100.80 and the relative strength index (RSI) heading down toward the oversold region, watch out for the development of price action along the support level.
If the DXY continues to trade lower the next key support level is at 100 which was last tested in April 2022.

Following the lead of the US Federal Reserve, the European Central Bank (ECB) announced its decision to hike rates by 25 basis points, taking interest rates in the Eurozone to 3.75% overnight. In the lead-up to the ECB meeting, there was some market speculation for a potential 50bps hike, which saw the EUR/USD trade to a 12-month high, reaching the 1.1095 price area. During the press conference, President Lagarde highlighted that the ECB was not pausing on future rate hikes, but she indicated some “uncertainty in policy transmission” and that it was “sensible to return to more standard increment”.
This led to the EUR/USD reversing strongly to trade lower and retest the 1.10 round number support level. As the EUR/USD continues to fluctuate between the 1.10 and 1.11 price level, further upside potential could be limited, with the key resistance level at the 1.12 price area. If the DXY recovers in strength, look for significant correction to the downside on the EUR/USD with the next key support level at 1.08.
However, confirmation for the downward move would be signaled only if the price breaks below the crucial level of 1.095 which is a confluence of levels with the 23.60% Fibonacci retracement, short-term upward trendline, and the 200 moving average.

Crude Oil has always been one of the most popular and highly traded markets for CFD traders whether it is WTI or Brent, especially recently as geopolitical and economic forces have seen its price fluctuate from extreme lows to extreme highs. It’s easy to see why, Oil is a bellwether for the health of the global market, oil greases the wheels of global commerce and with CFDs it’s possible to take a position in this exciting market, whether you think the price will head up or down. In this CFD Oil trading Article we will look at the following: How to use CFDs to trade oil Fundamental forces that drive the price of oil Popular technical strategies for trading oil CFDs How to use CFDs to trade oil CFDs or Contracts For Difference allow you to speculate on the price of oil, without owning the underlying asset.
A spot oil CFD tracks the price of the spot market being the cleanest and most efficient way to speculate on the price of oil. They also allow you to take a position in both directions, you would enter a buy (Long) positions if you believed the price will rise, or a sell (Short) position if you believe the price will fall. With Long positions you are looking to buy and sell at a higher price at a later time to profit on the trade.
With a Short position you are selling with the view to buy back at a later time to profit on the trade. At GO Markets we offer our clients the worlds most popular oil trading platform in Metatrader 4 and 5, another advantage to these CFD trading platforms is the ability to automate oil trading strategies. Other advantages to trading oil CFDs with GO Markets: Trade 23 hours a day on WTI oil, 21 hours a day on Brent oil, unlike an ETF or oil company listed on a stock exchange that is only open while that stock exchange is open.
Leverage – the margin required to open the trade will be a fraction of the face value of the position depending on what leverage you are comfortable with. Flexibility in position sizing starting from 0.1 lot ($0.10 USD per point movement in oil) unlike oil futures which have rigid contract sizes. Rolling contract, no expiries such as in options or futures to worry about.
To Enter a position in Metatrader, you would bring up a deal ticket by clicking “New Order” then select your position size, any Stop Loss or Take Profit levels you want the position to automatically close at and hit Buy or Sell. As with any instrument, make sure you are familiar with the lot sizing. 1 standard lot in oil (USOUSD and UKOUSD) is 100 barrels, or $1 USD a point so make sure you set the volume to a level commensurate to your account size and risk appetite. Now, the next question is how you decide on a buy or sell, let’s look at the fundamentals of what drives oil and some technical analysis you can use to answer this question.
Fundamental forces that drive the price of oil Both WTI oil (USOUSD) and Brent Oil (UKOUSD) are highly correlated and will both be referenced as “oil” in the below. While no one reason can be fully attributed to movements in the price of oil, there are an important few fundamental drivers that will influence the price and whose relationship has been time tested. None of these on their own should be used as a sole reason to enter a position, but having the fundamentals on your side will certainly give you an advantage.
The main fundamental drivers in my experience are The perceived health of the global economy OPEC+ production cuts or increases Geopolitical issues The perceived health of the global economy Oil is the driver of commerce, it is needed for the transport and manufacturing of goods and getting people around. If economic conditions are deteriorating, it means less economic activity and the need for less oil sending the price down. A global economy which is seen as “hot” means more economic activity and more demand for oil, seeing it’s price increase.
A clear chart to see this is the price of oil as compared to the US 10-year bond yield over the years. You can see the price of oil and the yield are highly correlated, this is due to yields going up when the economy is “hot” and yields falling when the economy enters a period of contraction, similar price drivers to oil. The black line is WTI oil price, the orange US 10-year yields going back 10 years.
Source: tradingview.com OPEC+ production cuts or increases The Organization of the Petroleum Exporting Countries (OPEC) is a cartel of leading oil-producing countries formed in order to collectively influence the global oil market. OPEC started with a handful of Middle Eastern oil producers in 1960, and has since grown to 24 members in OPEC+. Even thought the USA is currently the worlds top oil producer, OPEC+ countries as a whole still dominate global oil supply and decisions made by the cartel can have a dramatic influence on the price of crude oil.
Market share of oil producing nations: Source: gisreportsonline.com OPEC+ hold regular meetings during the year, normally the expected result is well telegraphed, but sometimes there can be a surprise, such as at their latest meeting on Sunday April 2 nd, 2023, where a surprise production cut was announced, seeing the price of oil gap significantly higher on Mondays open, showing oil traders to always approach these meetings with caution. Geopolitical issues The last three years has seen some very influential geopolitical events, or “black swans” and oil being closely tied to the health of the global economy has seen some very big moves on the back of these events. The Pandemic and its related lock downs and slowing of global commerce saw the price of oil slump to all time lows, followed by the war in Ukraine which saw oil jump to multi year highs on the fear of supply disruptions (Russia is the second biggest oil producer in the world) The chart below illustrates this: Oil traders especially need to be aware of geopolitical risks as the above chart shows.
Technical strategies for trading oil CFDs While having a good understanding of the fundamentals (in my opinion) is important to help you choose the best trades most traders will use a combination of technical analysis and fundamentals with the aim for higher probability outcomes in their trades. Some traders will use technical analysis exclusively without any interest in the fundamental drivers using things such as RSI oscillators, support and resistance areas and trend lines solely to decide on their trade direction. Which option is best is solely up to the trader, their time frames for the trades and risk appetite, all can work, and all can fail neither option can be seen as “better” than the other, it all depends on the individual trader.
Technical analysis is an art in itself and there is a lot to learn on this subject, I encourage anyone interested to research the many weird and wonderful technical analysis strategies that are documented online. But let’s take a look at a popular technical indicators that oil traders use to make their trades. Support and Resistance Support and resistance are one of the most widely used and accurate (when used correctly) technical indicators that can be used by traders.
Support and Resistance areas are points in the market where the price is held from going lower (Support) or going higher (Resistance), these are areas where buyers or sellers are entering the market as they see value in the asset at that price. These levels can last a long time or be temporary and can be used to predict turn arounds in the market, or a break of these levels could indicate a further push in that direction. Oil is also particularly sensitive to psychological levels around “big figures” or rounded number, e.g. 79.00 and 74.00 As can be seen on the chart below.
Hopefully this article has given you an interest to learn more about trading oil with CFDs. Feel free to contact the GO Markets team if you have any questions on trading oil CFDs and opening an account with us.
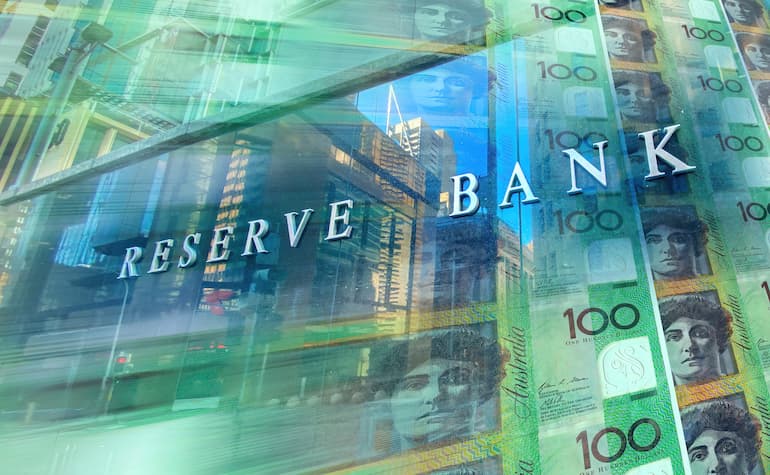
The Australian interest rate is currently at 3.85% and the most recent consumer price index (CPI) released at 6.8% which indicates slightly higher than expected inflation growth (expectation was 6.4% with previous data at 6.3%). This puts more focus on the upcoming interest rate decision from the Reserve Bank of Australia (RBA). While further rate hikes could apply added pressure onto the economy as households face increasing mortgage repayments, on the other hand, the series of previous rate hikes have not signaled that inflation growth is likely to slow down sustainably towards the RBA’s target level.
Market analysts are split between a hawkish hold (keeping rates at 3.85% while signaling a possible hike in the 3rd quarter, depending on further data) or continuing with another hike of 25bps to 4.1%. With the AUDUSD currently trading along the 0.66 price level, a hawkish interest rate decision from the RBA could see the AUDUSD break above the resistance at 0.6650, formed by the 200 moving average. The expected price action could be similar to that seen following the RBA’s surprise decision to hike rates by 25bps at the May meeting.
In this scenario, the AUDUSD could trade toward the immediate key resistance level of 0.68 with further sustained upside likely to depend on the volatility of the DXY.
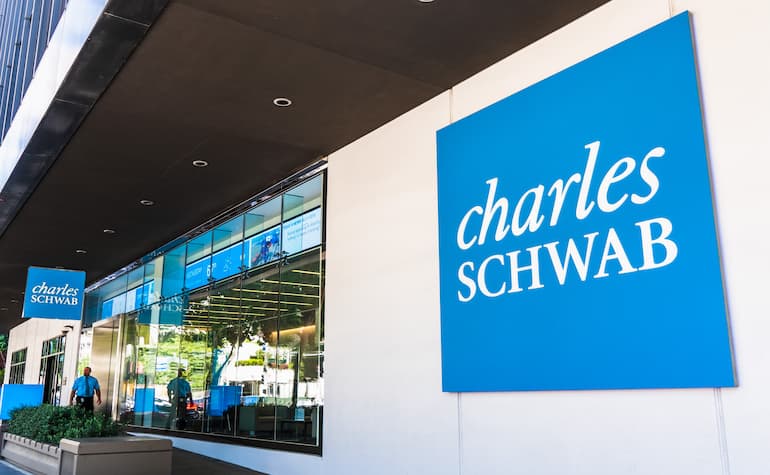
Charles Schwab Corporation (NYSE: SCHW) announced the latest financial results for the first three months of 2023 ended March 31, before the opening bell on Wall Street on Monday. Company overview Founded: 1971 Headquarters: Westlake, Texas, United States Number of branches: 400 Number of employees: 35,300 (as of December 2022) Industry: Financial services Key people: Charles R. Schwab (co-chairman), Walter W.
Bettinger (co-chairman & CEO) The results The company reported revenue that fell slightly short of analyst expectations at $5.116 billion vs. $5.134 billion estimate. Earnings per share reported at $0.93 per share for the quarter vs. $0.90 per share expected. CEO commentary ''When I drafted my first letter to stockholders 15 years ago in the middle of the financial crisis, I outlined four factors that helped distinguish Schwab from other financial institutions during a very challenging time for global markets: a strong financial foundation, a client-centric strategy, a disciplined operating approach, and a diversified business model.
These characteristics remain every bit as relevant to our story today. We continue to consistently manage the business in a conservative manner, with an unwavering long-term orientation. Our ongoing commitment to this consistency of mission, including our “Through Clients’ Eyes” strategy, highlights why we maintain the ability to meet the needs of individual investors and the advisors who serve them through various environments,'' CEO, Walter W.
Bettinger said in a letter to shareholders. ''While equity markets rebounded from year-end 2022 levels, investor sentiment remained bearish – especially following the onset of the banking industry turmoil in early March. Fixed income markets also reflected growing fears of an economic downturn as the 10-year U.S. Treasury yield declined approximately 50 basis points from its intra-quarter peak to end March just under 3.50%.
Through the various ups and downs to start the year, Schwab remained a trusted partner to investors. During the quarter, clients opened over 1 million new brokerage accounts and entrusted us with $132 billion of core net new assets – including over $53 billion in March alone. While Investor Services gathered approximately $60 billion during the period, the Advisor Services segment posted a record first quarter with over $71 billion in net flows and attracted 70 transitioning advisor teams.
These near-record inflows across both our primary businesses represents an annualized organic growth rate north of 7% and helped push total client assets to $7.58 trillion at quarter-end.'' Shares closed up by +3.94% on Monday at $52.73 a share. Stock performance 1 month: -6.55% 3 months: -36.81% Year-to-date: -37.02% 1 year: -30.03% Charles Schwab Corporation price targets Barclays: $56 Morgan Stanley: $65 Citigroup: $65 Credit Suisse: $68 Goldman Sachs: $75 Deutsche Bank: $83 Piper Sandler: $95 JP Morgan: $97 Charles Schwab Corporation is the 147 th largest company in the world with a market cap of $95.10 billion, according to CompaniesMarketCap. You can trade Charles Schwab Corporation (NYSE: SCHW) and many other stocks from the NYSE, NASDAQ, HKEX, ASX, LSE and DE with GO Markets as a Share CFD.
Sources: Charles Schwab Corporation, TradingView, MarketWatch, MetaTrader 5, Benzinga, CompaniesMarketCap, Wikipedia
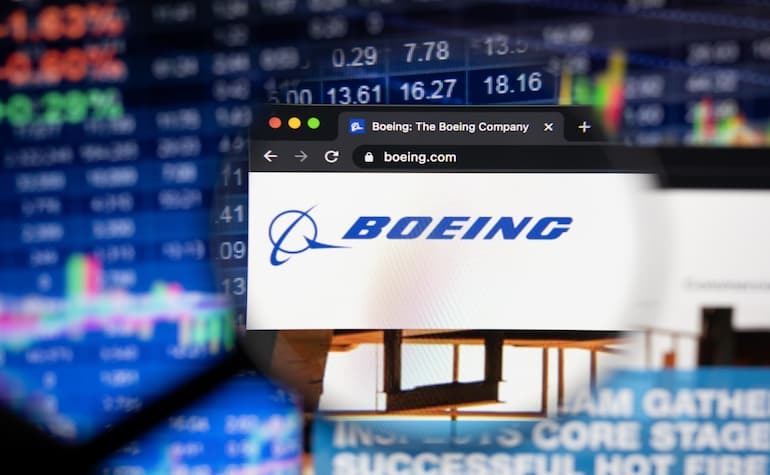
The Boeing Company (NYSE: BA) announced Q1 financial results before the market open in the US on Wednesday. World’s largest aerospace company posted mixed results. Let’s take a close look at how it performed.
Company overview Founded: July 15, 1916 Headquarters: Arlington County, Virginia, United States Number of employees: 156,000 (2022) Industry: Aerospace Key people: Dave Calhoun (President and CEO), Larry Kellner (Chairman) The results Boeing reported revenue of $17,921 billion for the quarter, topping analyst estimate of $17.516 billion. Revenues were up by 28% compared to the same period last year. The company reported loss per share of -$1.27, which exceeded analyst estimate of -$1.073 loss per share.
CEO commentary "We delivered a solid first quarter and are focused on driving stability for our customers," Dave Calhoun, CEO of Boeing said in a letter to shareholders. "We are progressing through recent supply chain disruptions but remain confident in the goals we set for this year, as well as for the longer term. Demand is strong across our key markets and we are growing investments to advance our development programs and innovate strategic capabilities for our customers and for our future," Calhoun concluded. The latest results had a positive impact on the share price.
The stock was up by around 2% on Wednesday at $207.62 a share. Stock performance 1 month: +0.94% 3 months: -1.29% Year-to-date: +10.21% 1 year: +35.91% Boeing price targets Susquehanna: $260 Bernstein: $252 Credit Suisse: $220 Northcoast Research: $180 Cowen & Co.: $230 Boeing is the 95 th largest company in the world with a market cap of $126.05 billion, according to CompaniesMarketCap. You can trade The Boeing Company (NYSE: BA) and many other stocks from the NYSE, NASDAQ, HKEX, ASX, LSE and DE with GO Markets as a Share CFD.
Sources: The Boeing Company, TradingView, MarketWatch, MetaTrader 5, TipRanks, CompaniesMarketCap, Wikipedia