The information provided is of general nature only and does not take into account your personal objectives, financial situations or needs. Before acting on any information provided, you should consider whether the information is suitable for you and your personal circumstances and if necessary, seek appropriate professional advice. All opinions, conclusions, forecasts or recommendations are reasonably held at the time of compilation but are subject to change without notice. Past performance is not an indication of future performance. Go Markets Pty Ltd, ABN 85 081 864 039, AFSL 254963 is a CFD issuer, and trading carries significant risks and is not suitable for everyone. You do not own or have any interest in the rights to the underlying assets. You should consider the appropriateness by reviewing our TMD, FSG, PDS and other CFD legal documents to ensure you understand the risks before you invest in CFDs. These documents are available here.
Any references to Australian or international shares, sectors, indices, ETFs, crypto-related stocks or other instruments are provided for market commentary and watchlist purposes only and do not constitute a recommendation, offer or solicitation to buy, sell or hold any financial product or adopt any investment strategy. International markets may involve additional risks, including currency fluctuations, regulatory differences, market structure differences, reduced liquidity and higher volatility. Company-specific, sector-specific and macroeconomic risks may also affect performance.
Commentary on geopolitical developments, economic data, central bank decisions, earnings, policy changes and other global or financial market events is based on information available at the time of publication and may change without notice. Such events can lead to sudden market moves, price gaps, reduced liquidity, wider spreads and increased volatility, particularly in leveraged products such as CFDs. Forward-looking statements, expectations and scenario analysis are inherently uncertain and should not be relied on as guarantees of future market behaviour or outcomes.
New Zealand Dollar jumps to two-week top vs weak USD as RBNZ's Conway hints rate hikes

- NZD/USD catches fresh bids as a sharp fall in US bond yields drags the USD away from an 18-month top.
- Hawkish comments from RBNZ Chief Economist Paul Conway provide an additional boost to the NZD.
- Fed hike bets and geopolitical risks could limit USD losses as the focus now shifts to the US PPI report.
The NZD/USD pair gains strong positive traction during the Asian session on Thursday, building on the previous day's late rebound from the 0.5565 region, or its lowest level since April 2025. The momentum lifts spot prices to a nearly two-week top, around the 0.5635 zone, and is supported by a combination of factors.
Despite Wednesday's hot US consumer inflation figures, investors seem convinced that the Federal Reserve (Fed) will keep interest rates steady at its October policy meeting. Adding to this, a Bloomberg report suggests that China seems to be moving US securities to non-US custodian banks in other countries, triggering a steep decline in US bond yields. This, in turn, prompts some follow-through US Dollar (USD) profit-taking and drags it away from an 18-month high, offering some support to the NZD/USD pair.
Meanwhile, Reserve Bank of New Zealand (RBNZ) Chief Economist Paul Conway said that the late-October rate decision is completely open and that the central bank still sees the OCR as most likely to rise, though it has not decided on timing. This, in turn, provides an additional boost to the New Zealand Dollar (NZD) and contributes to the bid tone surrounding the NZD/USD pair. That said, the USD corrective slide is likely to be limited, warranting some caution before confirming that spot prices have bottomed out.
According to the CME Group's FedWatch Tool, market participants are still pricing in over an 85% chance that the US central bank will raise borrowing costs again by the end of this year. Moreover, inflation risks stemming from volatile energy prices underpin prospects for further Fed tightening. Adding to this, the geopolitical risk premium remains in play amid escalating tensions in the Middle East and the US-Iran standoff over the Strait of Hormuz, which could support the safe-haven buck and cap the NZD/USD pair.
Traders now look forward to the release of the US Producer Price Index (PPI), due later during the North American session, for some impetus. Apart from this, Fed Chair Kevin Warsh's speech at the annual meetings of the IMF and World Bank in Bangkok on Friday will be looked upon for more cues about the future policy path. The outlook, in turn, will play a key role in influencing the near-term USD price dynamics and provide some meaningful impetus to the NZD/USD pair.
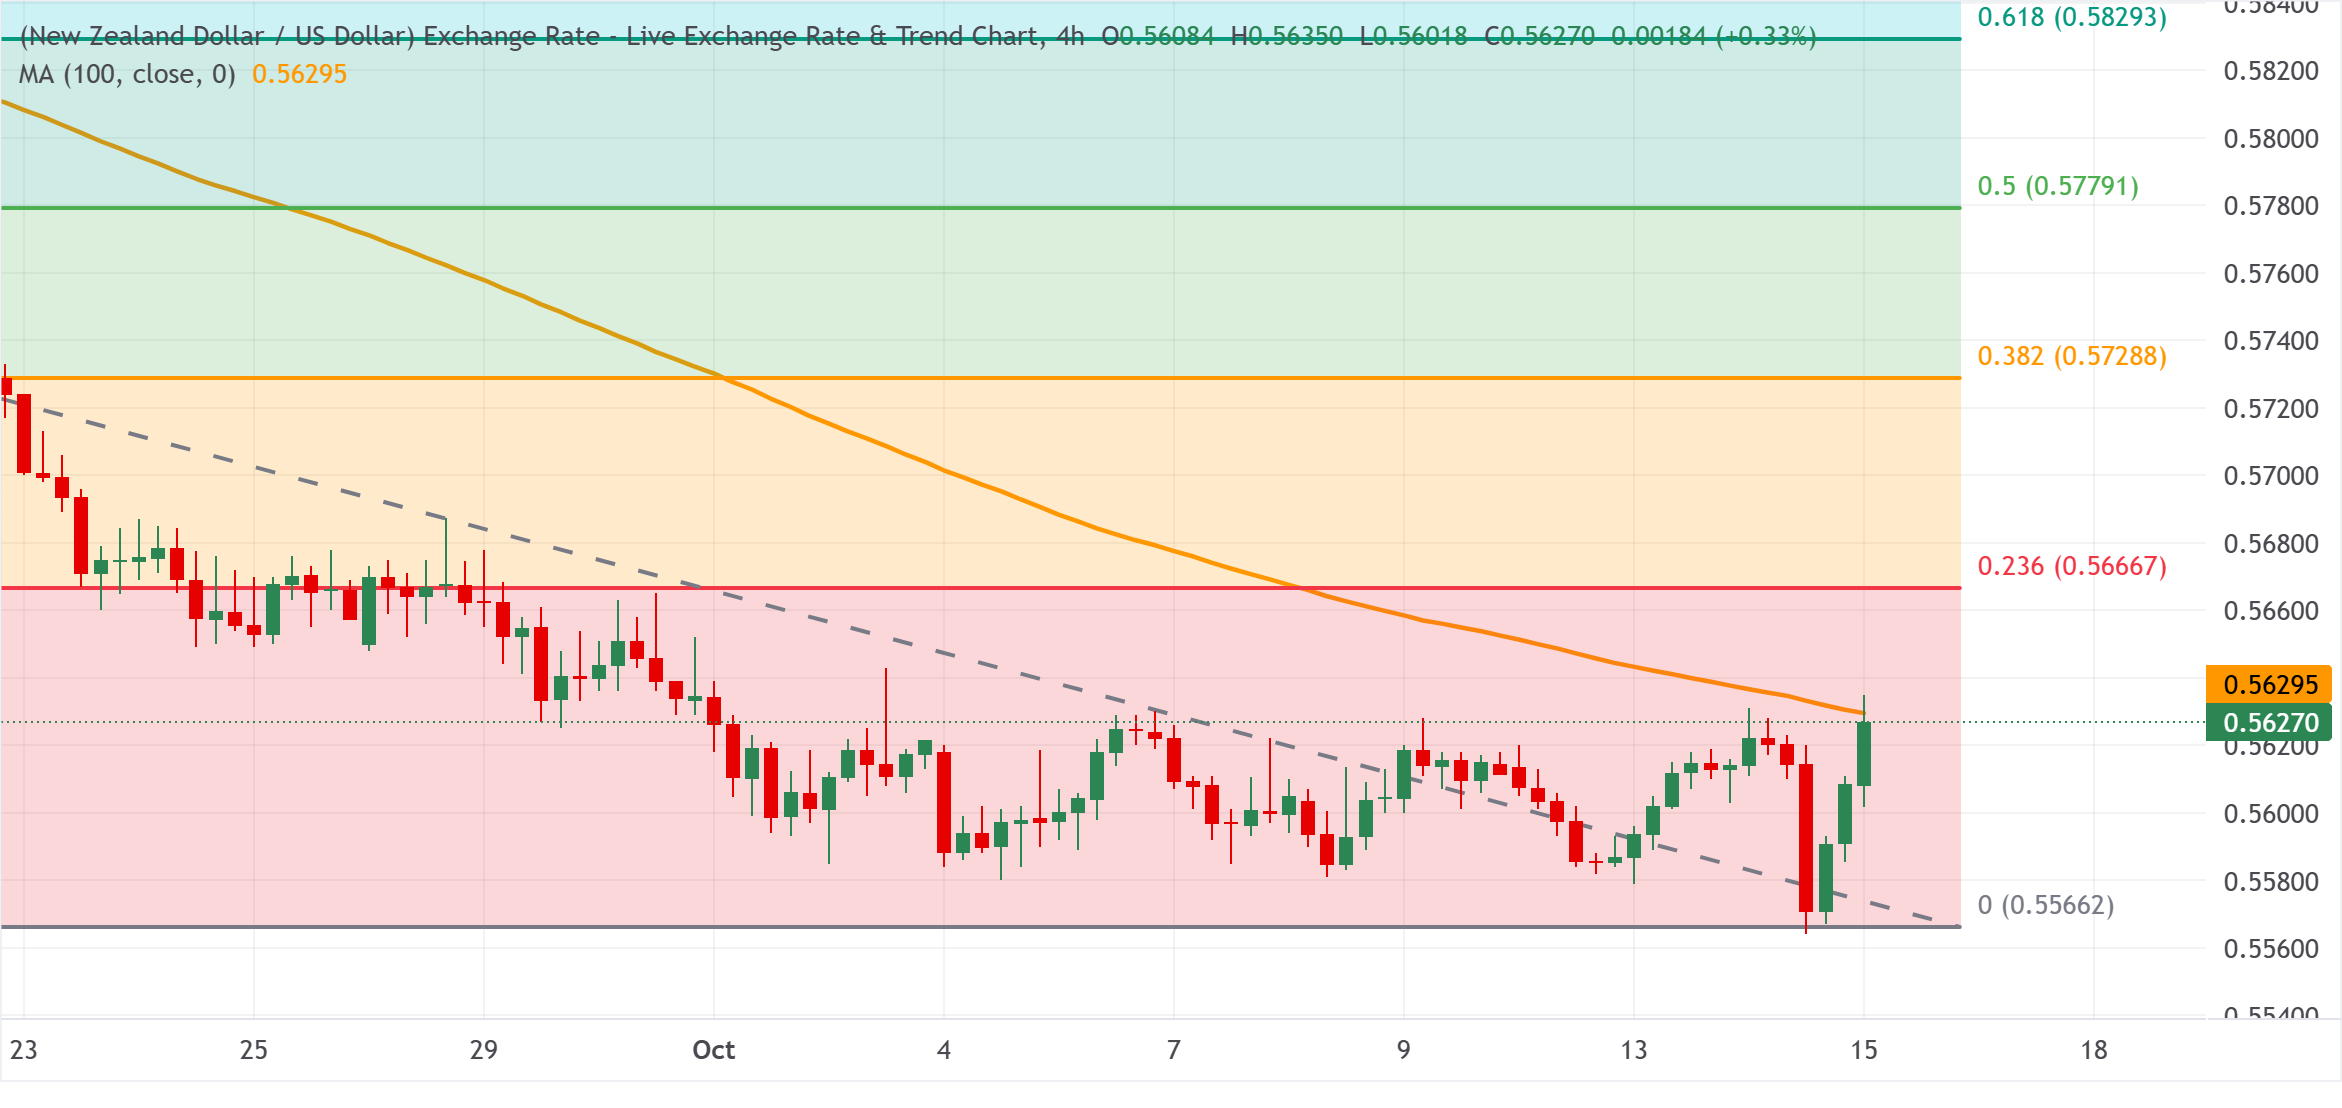
NZD/USD 4-hour chart
Technical Analysis
The NZD/USD pair struggles to build on intraday gains beyond the 100-period Simple Moving Average (SMA). Moreover, spot prices keep a bearish near-term tone beneath the 23.6% Fibonacci retracement, suggesting that any further move up is likely to face supply into the mid-0.5600s.
Further up, the 50.0% retracement at 0.5779 and the 61.8% level at 0.5829 build a dense cap ahead of 0.5901 and 0.5992. On the downside, the Fibonacci anchor at 0.5566 is the next notable support, where buyers could attempt to slow the decline.
(The technical analysis of this story was written with the help of an AI tool. Know more.)
US Dollar Price Today
The table below shows the percentage change of US Dollar (USD) against listed major currencies today. US Dollar was the strongest against the Australian Dollar.
| USD | EUR | GBP | JPY | CAD | AUD | NZD | CHF | |
|---|---|---|---|---|---|---|---|---|
| USD | -0.64% | -0.43% | -0.41% | -0.26% | 0.27% | -0.59% | -0.77% | |
| EUR | 0.64% | 0.21% | 0.21% | 0.35% | 0.95% | 0.04% | -0.14% | |
| GBP | 0.43% | -0.21% | 0.00% | 0.19% | 0.70% | -0.16% | -0.36% | |
| JPY | 0.41% | -0.21% | 0.00% | 0.14% | 0.70% | -0.21% | -0.37% | |
| CAD | 0.26% | -0.35% | -0.19% | -0.14% | 0.54% | -0.33% | -0.51% | |
| AUD | -0.27% | -0.95% | -0.70% | -0.70% | -0.54% | -0.87% | -1.05% | |
| NZD | 0.59% | -0.04% | 0.16% | 0.21% | 0.33% | 0.87% | -0.19% | |
| CHF | 0.77% | 0.14% | 0.36% | 0.37% | 0.51% | 1.05% | 0.19% |
The heat map shows percentage changes of major currencies against each other. The base currency is picked from the left column, while the quote currency is picked from the top row. For example, if you pick the US Dollar from the left column and move along the horizontal line to the Japanese Yen, the percentage change displayed in the box will represent USD (base)/JPY (quote).
Related Articles