The information provided is of general nature only and does not take into account your personal objectives, financial situations or needs. Before acting on any information provided, you should consider whether the information is suitable for you and your personal circumstances and if necessary, seek appropriate professional advice. All opinions, conclusions, forecasts or recommendations are reasonably held at the time of compilation but are subject to change without notice. Past performance is not an indication of future performance. Go Markets Pty Ltd, ABN 85 081 864 039, AFSL 254963 is a CFD issuer, and trading carries significant risks and is not suitable for everyone. You do not own or have any interest in the rights to the underlying assets. You should consider the appropriateness by reviewing our TMD, FSG, PDS and other CFD legal documents to ensure you understand the risks before you invest in CFDs. These documents are available here.
Any references to Australian or international shares, sectors, indices, ETFs, crypto-related stocks or other instruments are provided for market commentary and watchlist purposes only and do not constitute a recommendation, offer or solicitation to buy, sell or hold any financial product or adopt any investment strategy. International markets may involve additional risks, including currency fluctuations, regulatory differences, market structure differences, reduced liquidity and higher volatility. Company-specific, sector-specific and macroeconomic risks may also affect performance.
Commentary on geopolitical developments, economic data, central bank decisions, earnings, policy changes and other global or financial market events is based on information available at the time of publication and may change without notice. Such events can lead to sudden market moves, price gaps, reduced liquidity, wider spreads and increased volatility, particularly in leveraged products such as CFDs. Forward-looking statements, expectations and scenario analysis are inherently uncertain and should not be relied on as guarantees of future market behaviour or outcomes.
Nasdaq 100 leads US indexes lower on hot CPI and Nvidia

- NASDAQ, SPX and DJIA each give back about a sixth of Monday's rebound.
- Fed Governor Waller floats a half-point December hike, and the 10-year tops 5%.
- October producer prices are due Friday after a 1.3% jump in September.
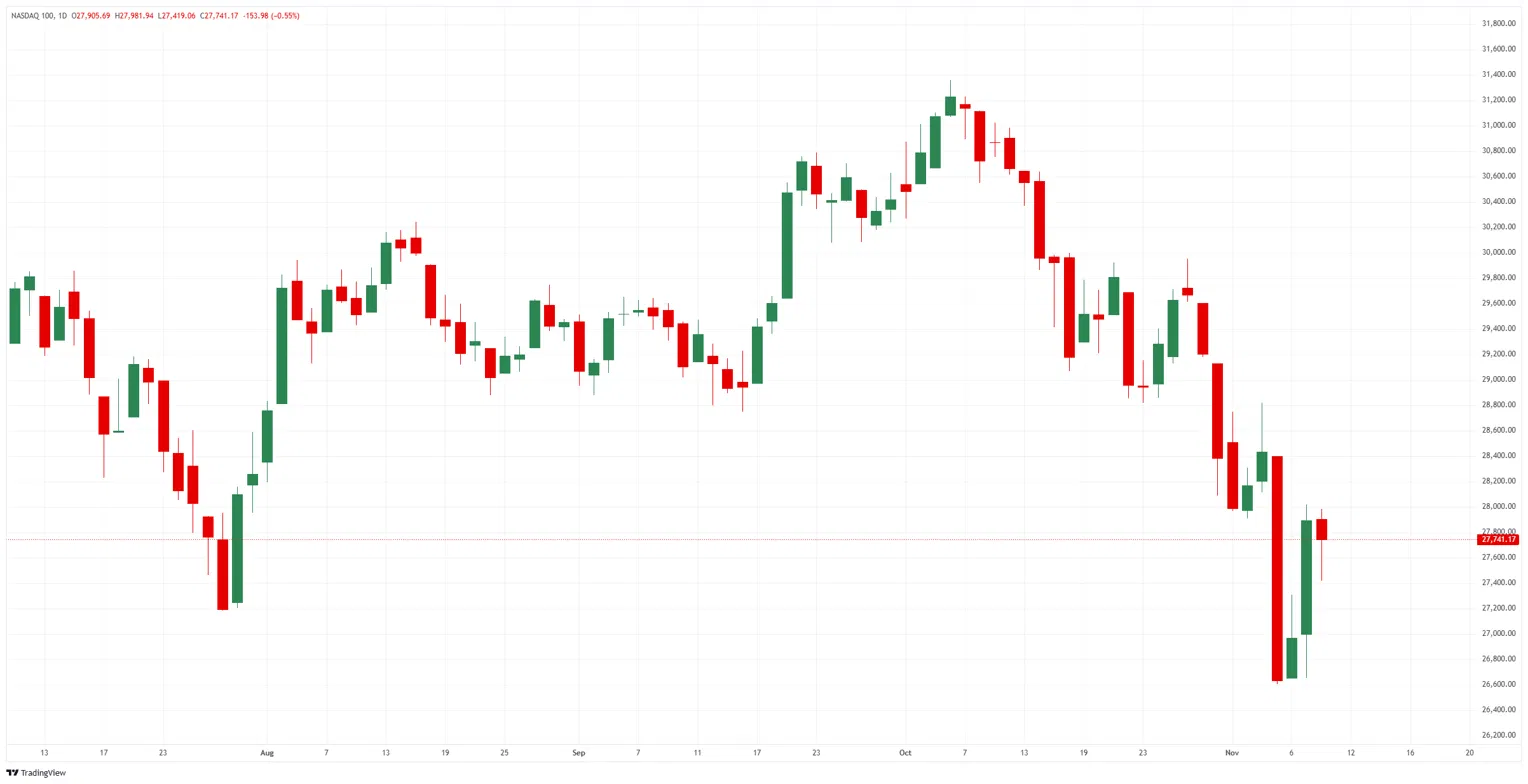
About a sixth of Monday's rebound is gone from all three US stock indexes after a hot October Consumer Price Index (CPI) and talk of a half-point Fed hike. The Nasdaq 100 gave back about half of Monday's gain, hitting a session low just above 27,400, and is now back near 27,750. The S&P 500 is near 7,525 and the Dow Jones Industrial Average near 52,250.
Consumer prices rose 0.4% in October, above the 0.3% forecast, the kind of overshoot Fed Governor Waller had said could call for a half-point December hike. The release had no annual rate, since the 2025 government shutdown left no October 2025 figure, and that rate returns on December 10, a day after the Fed decides. The 10-year Treasury yield is back above 5%, and a higher yield means stock buyers pay less for future profits.
Nvidia (NVDA), the world's most valuable company, lagged Monday's rally and is falling, which is dragging down all three indexes. The drop follows Chief Executive Jensen Huang's admission of an affair with a woman accused of spying for China. Chip stocks make up a larger share of the NASDAQ 100 than of the other two, and that index is falling the most of the three.
On the calendar
Fed Vice Chair for Supervision Bowman and Philadelphia Fed President Paulson speak at 23:30 GMT on Tuesday, and Cleveland Fed President Hammack at 14:00 GMT on Thursday. All three vote on the December 8-9 decision, where traders see a hike as close to certain, so what they say bears on its size.
Weekly jobless claims are due at 13:30 GMT on Thursday, forecast at 195K after 189K. October producer prices follow at 13:30 GMT on Friday, forecast up 0.4% after a 1.3% jump in September, the next inflation figure to bear on a half-point hike.
On the charts
The NASDAQ 100 has climbed back about a quarter of its fall from the October 6 high near 31,350. The S&P 500 is about two-fifths of the way back from its November 6 low near 7,325 to its October high just below 7,850. The Dow Jones Industrial Average is near the middle of the 50,500-53,800 range it has held since mid-September.
Nasdaq 100 index, daily chart
Nasdaq FAQs
The Nasdaq is a stock exchange based in the US that started out life as an electronic stock quotation machine. At first, the Nasdaq only provided quotations for over-the-counter (OTC) stocks but later it became an exchange too. By 1991, the Nasdaq had grown to account for 46% of the entire US securities’ market. In 1998, it became the first stock exchange in the US to provide online trading. The Nasdaq also produces several indices, the most comprehensive of which is the Nasdaq Composite representing all 2,500-plus stocks on the Nasdaq, and the Nasdaq 100.
The Nasdaq 100 is a large-cap index made up of 100 non-financial companies from the Nasdaq stock exchange. Although it only includes a fraction of the thousands of stocks in the Nasdaq, it accounts for over 90% of the movement. The influence of each company on the index is market-cap weighted. The Nasdaq 100 includes companies with a significant focus on technology although it also encompasses companies from other industries and from outside the US. The average annual return of the Nasdaq 100 has been 17.23% since 1986.
There are a number of ways to trade the Nasdaq 100. Most retail brokers and spread betting platforms offer bets using Contracts for Difference (CFD). For longer-term investors, Exchange-Traded Funds (ETFs) trade like shares that mimic the movement of the index without the investor needing to buy all 100 constituent companies. An example ETF is the Invesco QQQ Trust (QQQ). Nasdaq 100 futures contracts allow traders to speculate on the future direction of the index. Options provide the right, but not the obligation, to buy or sell the Nasdaq 100 at a specific price (strike price) in the future.
Many different factors drive the Nasdaq 100 but mainly it is the aggregate performance of the component companies revealed in their quarterly and annual company earnings reports. US and global macroeconomic data also contributes as it impacts on investor sentiment, which if positive drives gains. The level of interest rates, set by the Federal Reserve (Fed), also influences the Nasdaq 100 as it affects the cost of credit, on which many corporations are heavily reliant. As such the level of inflation can be a major driver too as well as other metrics which impact on the decisions of the Fed.
Related Articles