The information provided is of general nature only and does not take into account your personal objectives, financial situations or needs. Before acting on any information provided, you should consider whether the information is suitable for you and your personal circumstances and if necessary, seek appropriate professional advice. All opinions, conclusions, forecasts or recommendations are reasonably held at the time of compilation but are subject to change without notice. Past performance is not an indication of future performance. Go Markets Pty Ltd, ABN 85 081 864 039, AFSL 254963 is a CFD issuer, and trading carries significant risks and is not suitable for everyone. You do not own or have any interest in the rights to the underlying assets. You should consider the appropriateness by reviewing our TMD, FSG, PDS and other CFD legal documents to ensure you understand the risks before you invest in CFDs. These documents are available here.
Any references to Australian or international shares, sectors, indices, ETFs, crypto-related stocks or other instruments are provided for market commentary and watchlist purposes only and do not constitute a recommendation, offer or solicitation to buy, sell or hold any financial product or adopt any investment strategy. International markets may involve additional risks, including currency fluctuations, regulatory differences, market structure differences, reduced liquidity and higher volatility. Company-specific, sector-specific and macroeconomic risks may also affect performance.
Commentary on geopolitical developments, economic data, central bank decisions, earnings, policy changes and other global or financial market events is based on information available at the time of publication and may change without notice. Such events can lead to sudden market moves, price gaps, reduced liquidity, wider spreads and increased volatility, particularly in leveraged products such as CFDs. Forward-looking statements, expectations and scenario analysis are inherently uncertain and should not be relied on as guarantees of future market behaviour or outcomes.
Gold drifts lower as rebounding bond yields and Fed hike bets support USD ahead of US NFP

- Gold comes under renewed selling pressure as rebounding US bond yields support the USD.
- Oil-driven inflation fears keep Fed hike bets on the table, further weighing on the commodity.
- Traders now look forward to the release of the US NFP report for some meaningful impetus.
Gold (XAU/USD) attracts fresh sellers after failing to find acceptance above the $4,100 mark during the Asian session on Friday, extending the previous day's retracement slide from a two-week high. US bond yields recover slightly following the recent fall to a two-month low, helping the US Dollar (USD) to build on its recovery from the lowest level since late September, touched on Thursday. This, in turn, is seen as undermining the precious metal, though the downside seems limited as traders might refrain from placing aggressive directional bets ahead of the release of the crucial US monthly employment details.
The popularly known US Nonfarm Payrolls (NFP) report is anticipated to show that the economy added 65K new jobs in October, up from the previous month's softer reading of 29K. Meanwhile, the unemployment rate is forecast to hold steady at 4.2%. Apart from this, investors will pay close attention to Average Hourly Earnings, as wage growth pressures could heavily influence Federal Reserve (Fed) policy expectations. Nevertheless, the closely watched macroeconomic indicators are set to infuse some volatility in the financial markets and drive USD demand, providing some meaningful impetus to gold.
Meanwhile, a Democratic sweep in the US midterm elections sparked concerns of a slowdown in artificial intelligence development. This led to a bruising rout on Wall Street on Thursday and boosted demand for traditional safe-haven assets, like US government Treasuries. However, the sharp overnight recovery in crude oil prices reignited inflationary concerns. Moreover, traders are still pricing in around a 70% chance that the US central bank will raise borrowing costs again at its December meeting. This, in turn, triggers a modest bounce in US bond yields following the midweek slump and supports the Greenback.
Furthermore, the geopolitical risk premium remains in play amid the uncertainty over US President Donald Trump's next move. In fact, Trump said on Thursday that the US may have to destroy the rest of Iran and added that people will know soon enough if he acts. Moreover, the US and Iran remain divided over Tehran's nuclear program and the Strait of Hormuz. This offers additional support for the safe-haven buck, which is seen weighing on the Gold price. Nevertheless, the commodity seems poised to register gains for the first time in three weeks and holds comfortably above the $4,000 psychological mark.
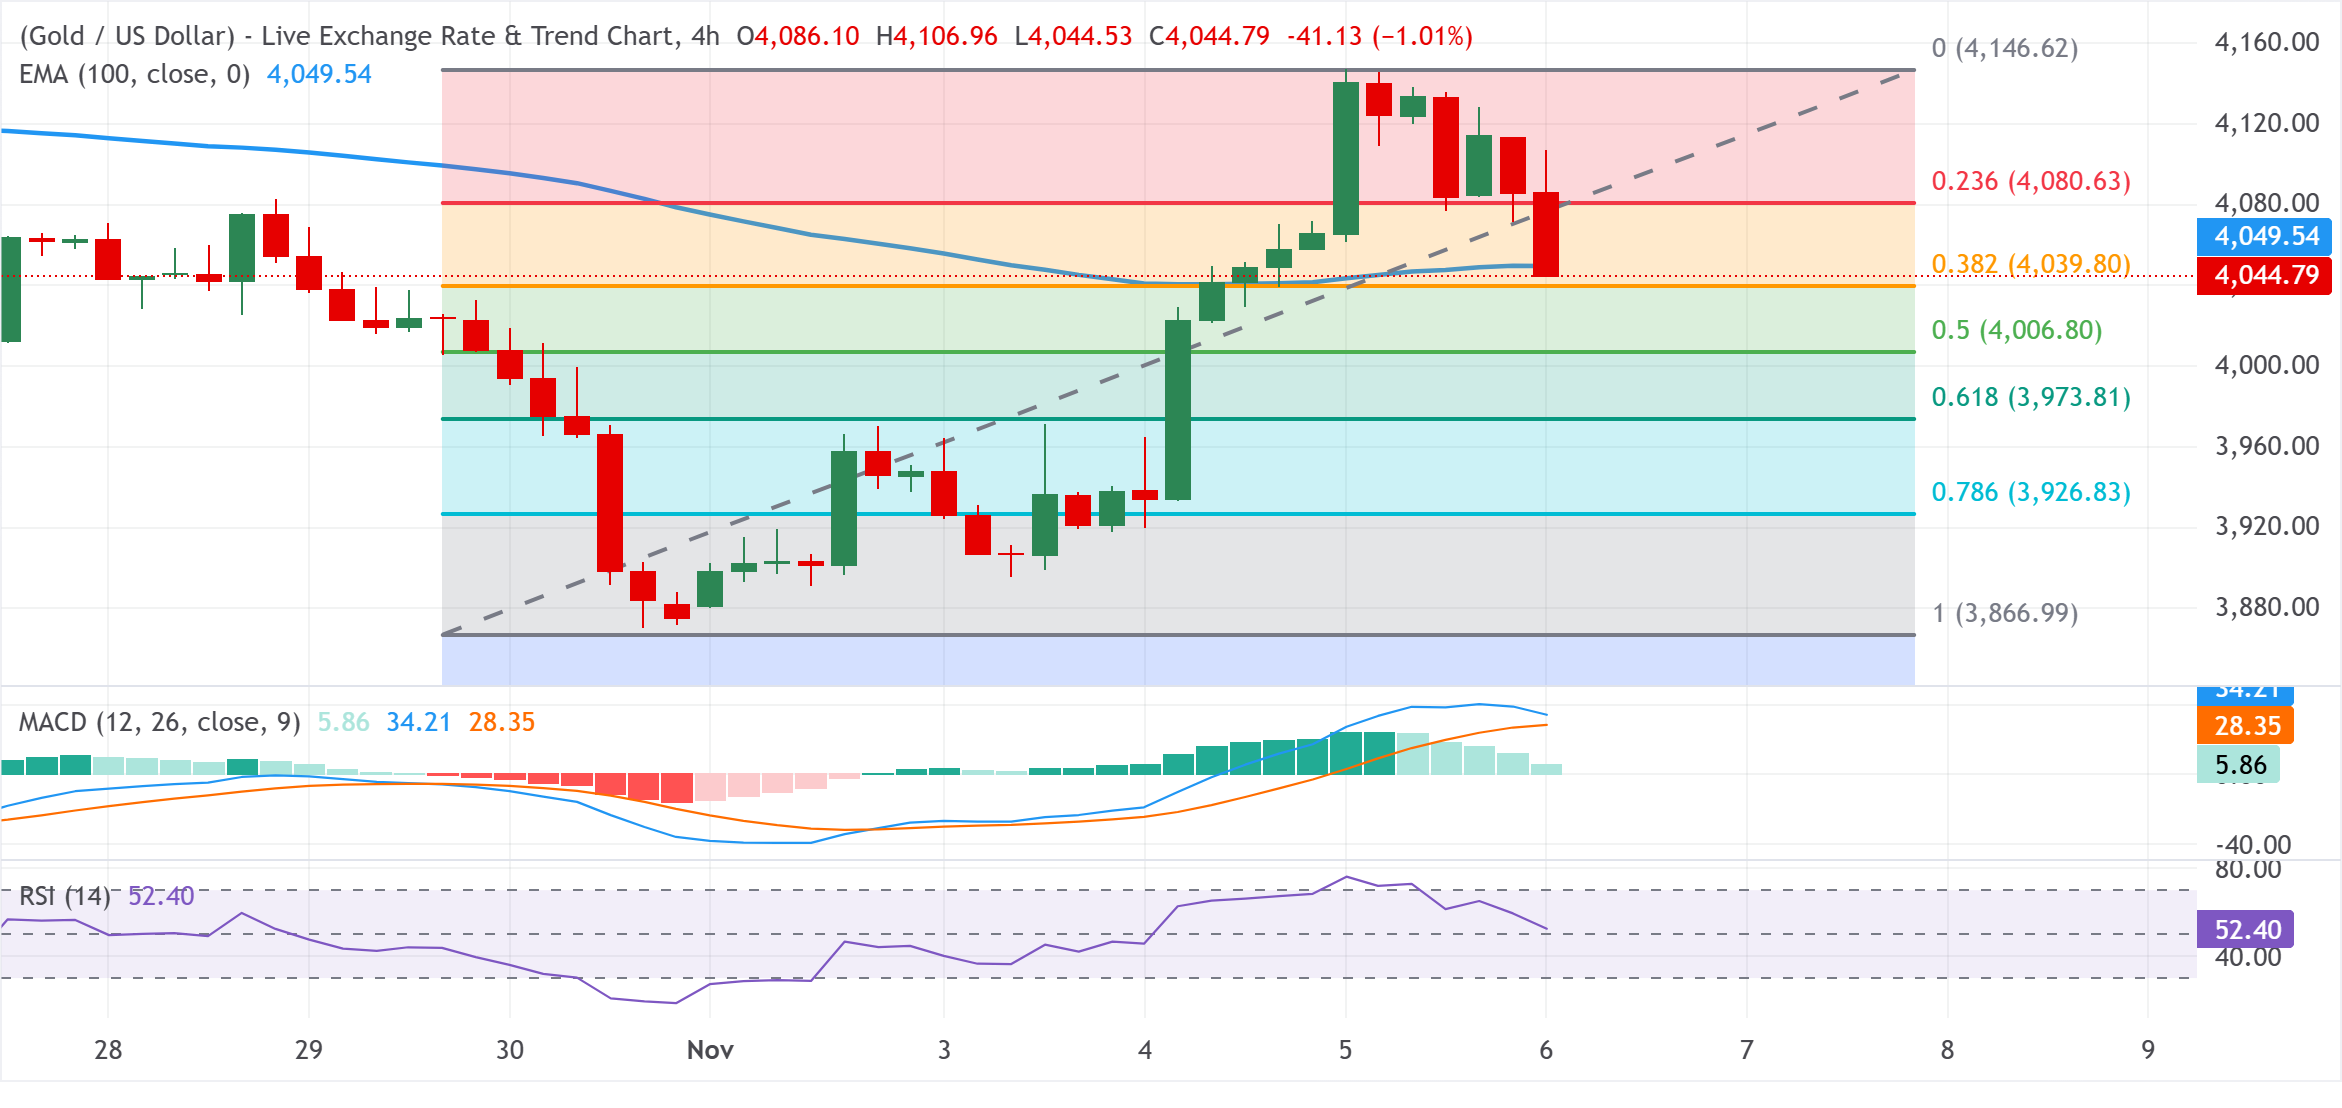
XAU/USD 4-hour chart
Technical Analysis
The XAU/USD pair holds a constructive near-term tone above the Fibonacci cluster between the 50.0% retracement at $4,006 and the 38.2% level at $4,039. However, an intraday slide below the 100-period Exponential Moving Average (EMA) on the 4-hour chart warrants caution for bulls. Moreover, the Relative Strength Index (RSI) at 52.40 has eased from overbought territory and now points to neutral-to-bid momentum. That said, the Moving Average Convergence Divergence (MACD) indicator maintains a positive reading with the MACD line above zero and prior gains in the histogram hinting that bullish pressure is merely pausing rather than reversing.
Hence, some follow-through selling below the 38.2% Fibo. retracement at $4,039 is needed to back the case for further losses to a deeper floor at the 50.0% retracement near $4,006. A break under these levels would expose the 61.8% retracement at $3,973 and the 78.6% level at $3,926. On the topside, immediate resistance aligns at the 23.6% retracement at $4,080, and a sustained move above that would open the way toward the recent cycle high at $4,146.
(The technical analysis of this story was written with the help of an AI tool. Know more.)
US Dollar Price Today
The table below shows the percentage change of US Dollar (USD) against listed major currencies today. US Dollar was the strongest against the New Zealand Dollar.
| USD | EUR | GBP | JPY | CAD | AUD | NZD | CHF | |
|---|---|---|---|---|---|---|---|---|
| USD | 0.18% | 0.13% | 0.00% | 0.22% | 0.52% | 0.62% | -0.00% | |
| EUR | -0.18% | -0.06% | -0.18% | 0.03% | 0.33% | 0.43% | -0.19% | |
| GBP | -0.13% | 0.06% | -0.11% | 0.08% | 0.39% | 0.49% | -0.13% | |
| JPY | 0.00% | 0.18% | 0.11% | 0.21% | 0.51% | 0.61% | -0.01% | |
| CAD | -0.22% | -0.03% | -0.08% | -0.21% | 0.30% | 0.40% | -0.22% | |
| AUD | -0.52% | -0.33% | -0.39% | -0.51% | -0.30% | 0.10% | -0.51% | |
| NZD | -0.62% | -0.43% | -0.49% | -0.61% | -0.40% | -0.10% | -0.60% | |
| CHF | 0.00% | 0.19% | 0.13% | 0.00% | 0.22% | 0.51% | 0.60% |
The heat map shows percentage changes of major currencies against each other. The base currency is picked from the left column, while the quote currency is picked from the top row. For example, if you pick the US Dollar from the left column and move along the horizontal line to the Japanese Yen, the percentage change displayed in the box will represent USD (base)/JPY (quote).
Related Articles