
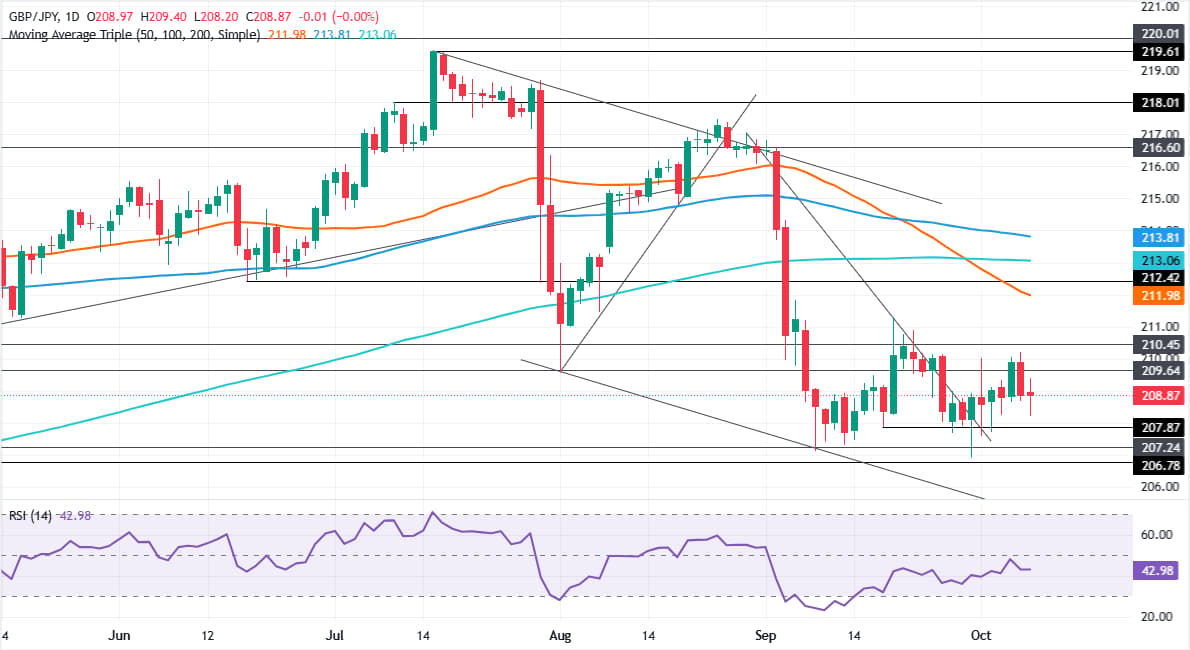
- GBP/JPY holds near 208.87 after rejecting the 209.40 high.
- RSI stays bearish near 43, signaling limited bullish momentum.
- Break below 208.20 exposes 208.00 and September low at 206.89.
The GBP/JPY seesaws on Thursday, poised to end the session unchanged at 208.87, after prices traveled from the low of the day (LOD) of 208.20, towards a daily high of 209.40, before settling at around current levels.
GBP/JPY Price Forecast: Technical outlook
Price action shows the GBP/JPY cross is still bearish, after diving over 4.46% following a coordinated two-day intervention between the US and Japan, with sellers pushing prices towards a yearly low of 207.10, hit on September 8.
Since then, the cross has recovered some ground but has remained within familiar levels. During the day, it hit an eight-day high of 210.20 on October 7 before retreating beneath 209.00.
The Relative Strength Index (RSI), although bearish, is flat near 43, suggesting that further consolidation lies ahead. Nonetheless, in the short term, the crossover of the 50-day Simple Moving Average (SMA) below the 200-day SMA indicates that bears are in control.
For a bearish resumption, sellers must clear the October 8 low of 208.20 before testing the 208.00 figure. On further weakness, the next support is the September 30 low of 206.89.
Should buyers push prices above 209.50, a test of 210.00 is on the cards. Above this level, the traders' target would be the September 18 high at 211.28, followed by the 50-day SMA at 211.98.
GBP/JPY Price Chart – Technical outlook
Japanese Yen Price Today
The table below shows the percentage change of Japanese Yen (JPY) against listed major currencies today. Japanese Yen was the strongest against the Australian Dollar.
| USD | EUR | GBP | JPY | CAD | AUD | NZD | CHF | |
|---|---|---|---|---|---|---|---|---|
| USD | -0.15% | -0.12% | -0.14% | -0.21% | 0.14% | -0.12% | -0.24% | |
| EUR | 0.15% | 0.03% | 0.02% | -0.08% | 0.22% | 0.06% | -0.08% | |
| GBP | 0.12% | -0.03% | 0.00% | -0.08% | 0.17% | 0.02% | -0.10% | |
| JPY | 0.14% | -0.02% | 0.00% | -0.11% | 0.19% | -0.01% | -0.08% | |
| CAD | 0.21% | 0.08% | 0.08% | 0.11% | 0.31% | 0.14% | -0.02% | |
| AUD | -0.14% | -0.22% | -0.17% | -0.19% | -0.31% | -0.13% | -0.28% | |
| NZD | 0.12% | -0.06% | -0.02% | 0.00% | -0.14% | 0.13% | -0.07% | |
| CHF | 0.24% | 0.08% | 0.10% | 0.08% | 0.02% | 0.28% | 0.07% |
The heat map shows percentage changes of major currencies against each other. The base currency is picked from the left column, while the quote currency is picked from the top row. For example, if you pick the Japanese Yen from the left column and move along the horizontal line to the US Dollar, the percentage change displayed in the box will represent JPY (base)/USD (quote).