The information provided is of general nature only and does not take into account your personal objectives, financial situations or needs. Before acting on any information provided, you should consider whether the information is suitable for you and your personal circumstances and if necessary, seek appropriate professional advice. All opinions, conclusions, forecasts or recommendations are reasonably held at the time of compilation but are subject to change without notice. Past performance is not an indication of future performance. Go Markets Pty Ltd, ABN 85 081 864 039, AFSL 254963 is a CFD issuer, and trading carries significant risks and is not suitable for everyone. You do not own or have any interest in the rights to the underlying assets. You should consider the appropriateness by reviewing our TMD, FSG, PDS and other CFD legal documents to ensure you understand the risks before you invest in CFDs. These documents are available here.
Any references to Australian or international shares, sectors, indices, ETFs, crypto-related stocks or other instruments are provided for market commentary and watchlist purposes only and do not constitute a recommendation, offer or solicitation to buy, sell or hold any financial product or adopt any investment strategy. International markets may involve additional risks, including currency fluctuations, regulatory differences, market structure differences, reduced liquidity and higher volatility. Company-specific, sector-specific and macroeconomic risks may also affect performance.
Commentary on geopolitical developments, economic data, central bank decisions, earnings, policy changes and other global or financial market events is based on information available at the time of publication and may change without notice. Such events can lead to sudden market moves, price gaps, reduced liquidity, wider spreads and increased volatility, particularly in leveraged products such as CFDs. Forward-looking statements, expectations and scenario analysis are inherently uncertain and should not be relied on as guarantees of future market behaviour or outcomes.
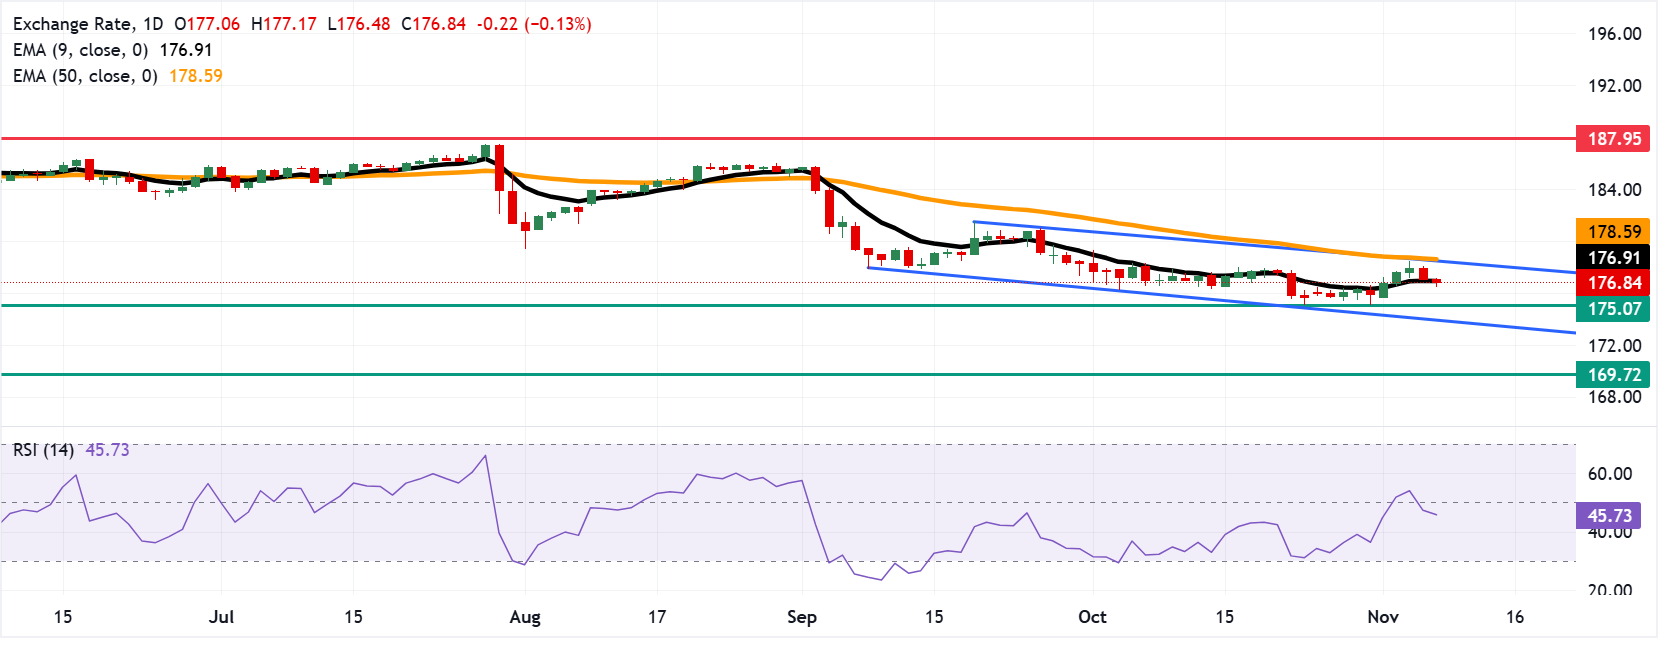
EUR/JPY Price Forecast: Trades near 176.50 after slipping below nine-day EMA

- EUR/JPY may find initial support at the 12-month low of 175.07.
- The 14-day Relative Strength Index is at 45.73, indicating subdued bullish momentum.
- The immediate barrier lies at the nine-day EMA of 176.91.
EUR/JPY loses ground for the second consecutive day, trading around 176.80 during Asian hours on Friday. The technical analysis of the daily chart suggests that the currency cross is remaining within a descending channel pattern, indicating a prevailing bearish bias.
The EUR/JPY cross is keeping a bearish near-term tone as it holds below both the nine- and 50-day Exponential Moving Averages (EMAs). The short- and medium-term EMAs above price suggest rallies remain capped for now, while the 14-day Relative Strength Index (RSI) at 45.73 stays below the neutral 50 line, hinting at subdued bullish momentum rather than outright oversold conditions.
The EUR/JPY cross may fall toward the initial support at the 12-month low of 175.07, reached on October 30, followed by the lower boundary of its descending channel around 174.00. A break below the channel would open the door for the currency cross to navigate the region around the 15-month low at 169.72.
On the upside, the EUR/JPY cross may rebound and test the immediate barrier at the nine-day EMA of 176.91, followed by the upper boundary of the descending channel near the 50-day EMA of 178.59. A successful break above the medium-term price average would cause a bullish reversal, supporting the EUR/JPY cross to explore the area around the all-time high of 187.95, reached on April 17.
Yen still weighed down by structural outflows despite distorted rate signals
Analysts at MUFG/BTMU note that recent official action has complicated the usual relationship between the Yen and interest rate differentials, with “intervention in last July / early August” having “distorted the link with rates.” However, they stress that the underlying message from the currency’s behaviour is clear: “what the movement of the yen does indicate is that there are still some structural flows that continue to weigh on yen performance and those flows could well be slow to change.” This suggests that, even as rate dynamics evolve, persistent portfolio and FDI outflows remain a key drag on JPY, and are unlikely to reverse quickly.
(The technical analysis of this story was written with the help of an AI tool. Know more.)
Euro Price Today
The table below shows the percentage change of Euro (EUR) against listed major currencies today. Euro was the weakest against the Japanese Yen.
| USD | EUR | GBP | JPY | CAD | AUD | NZD | CHF | |
|---|---|---|---|---|---|---|---|---|
| USD | 0.18% | 0.12% | -0.02% | 0.20% | 0.54% | 0.58% | -0.01% | |
| EUR | -0.18% | -0.07% | -0.21% | 0.03% | 0.36% | 0.40% | -0.20% | |
| GBP | -0.12% | 0.07% | -0.13% | 0.10% | 0.43% | 0.47% | -0.13% | |
| JPY | 0.02% | 0.21% | 0.13% | 0.23% | 0.57% | 0.60% | 0.00% | |
| CAD | -0.20% | -0.03% | -0.10% | -0.23% | 0.33% | 0.37% | -0.22% | |
| AUD | -0.54% | -0.36% | -0.43% | -0.57% | -0.33% | 0.04% | -0.56% | |
| NZD | -0.58% | -0.40% | -0.47% | -0.60% | -0.37% | -0.04% | -0.58% | |
| CHF | 0.01% | 0.20% | 0.13% | -0.01% | 0.22% | 0.56% | 0.58% |
The heat map shows percentage changes of major currencies against each other. The base currency is picked from the left column, while the quote currency is picked from the top row. For example, if you pick the Euro from the left column and move along the horizontal line to the US Dollar, the percentage change displayed in the box will represent EUR (base)/USD (quote).
Related Articles