
热门话题
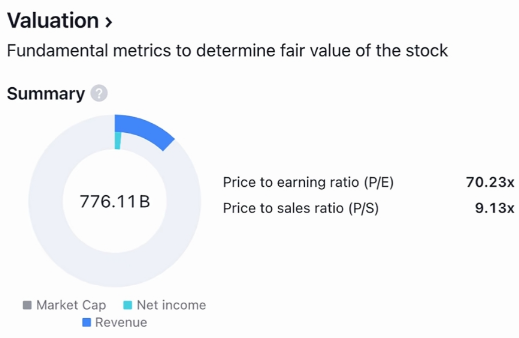
你好,美好的一天从出行开始。智能驾驶技术的逐步成熟,对传统的出行领域产生的冲击最大。马斯克曾在二季度财报电话会议中表示,自动驾驶出租车(Robotaxi)将是特斯拉的未来——车主离开车以后,让汽车加入Robotaxi车队可以帮助车主赚钱获得可观收益。这项技术一旦成熟,智能驾驶汽车将大规模涌入市场。根据HIS Markit预测,光中国共享出行市场就会在2030年达到2.25万亿元。特斯拉曾经是汽车创新的核心,马斯克愿景下的特斯拉应该拥有自己的生态系统,可以销售从自动驾驶技术到太阳能板和储能电池的一切。经历了2021年的高速发展,特斯拉先于英伟达一年达成万亿美元市值这个里程碑,投资者说它是汽车界的 “苹果”。然而目前特斯拉似乎面临成为另一个普通汽车制造商的风险。美国福特和通用汽车公司,欧洲的大众和宝马,以及亚洲的比亚迪、蔚来、丰田和现代都在生产电动车,就连特斯拉提供的高科技功能例如酷炫的屏幕、应用程序和加速性能,在梅赛德斯的豪华奔驰EQE到更加实惠的雪佛龙Equinox车型中都能找到。特斯拉的竞争优势越来越小,近两年股价在创纪录高点下跌了40%,不过特斯拉仍然享受溢价估值,其市盈率接近未来12个月预期收益的90倍,与Palantir Technologies和Snowflake等飞速发展的科技公司齐名。
仅次于安全性,超过50%的新能源用户选购汽车时关注其智能化,而特斯拉Robotaxi目前的核心挑战就在于FSD(无人监管全自动驾驶)技术能否实现突破,所以本次Robotaxi发布会可谓是马斯克的一次“信仰之跃”,特斯拉股价是重回巅峰还是就此跌落,成王败寇,在此一搏。

本次Robotaxi发布会中可能会提到的、也是投资者会关注的关键议题有以下3个:第一当然就是FSD(全自动驾驶)技术改进能否达到Robotaxi标准或者距离达标还有多远。根据Tesla AI “路线图”看,V13预计将会在本月发布,必要干预之间的行驶里程将提高6倍,但这有没有达到真正Robotaxi产品的标准呢?市场还没有基准数据。根据今年加州DMV(机动车辆管理局)开始披露的无驾驶员自动驾驶车辆的数据,特斯拉自动驾驶领域的主要竞争对手Waymo车辆行驶119万英里,发生了14次脱离,即每84,923英里发生一次脱离,因此Waymo认为在移除驾驶员之前,系统需要实现约5倍的改进。瑞银的分析师预估,如果假设加州监管机构认为每85,000英里发生一次脱离达标,那么FSD干预之间行驶里程还需要提高770倍。

第二,马斯克愿景中的“特斯拉车队”运营模式是否足够清晰能落地。马斯克的愿景是任何拥有特斯拉的人都可以将自己的车辆加入“特斯拉网络”,车主不用车时可以授权载客赚取收益,打造一种“Airbnb on wheels”模式。根据路线图,特斯拉计划于2025年Q1在美国监管批准的前提下推出这只FSD车队,但是在中国和欧洲的审批可能更复杂艰难。在独立运营阻碍较大的情况下,如果特斯拉像Waymo一样和Uber合作,这种合作模式对特斯拉自身利润的影响是需要明确的。第三,Robotaxi 的经济效益和可服务市场规模(TAM),发布会上可能会再次给出估测数据。在2019年4月首次“自动驾驶日”活动中,特斯拉曾表示,如果以50%的使用率计算,一辆Robotaxi的平均成本不到0.18美元/英里;每英里的毛利润可以达到0.65美元,相当于每辆车能给车主带来3万美元的毛利润。我们预计马斯克会在发布会上再次提到AI方面投资的规模和产出,今年特斯拉在AI相关的支出大约100亿美元,英伟达硬件占成本的2/3,老话重提,Robotaxi商业化进程是决定高昂AI支出能否转化为盈利的重要因素。
根据Wurth Automative数据,截至8月,特斯拉在美国的销量同比下降近10%,而美国整体电动车销量也仅增长了7%,与2023年特斯拉25%的增长率、行业46%的增长率相差甚远。华尔街分析师预计特斯拉本年度交付约180万辆汽车,与2023年基本持平,低于一年前230万辆的预期,华尔街对特斯拉的股价上涨预期需要靠本次Robotaxi推动。
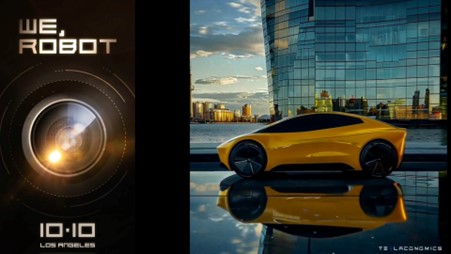
巴菲特最看重的就是企业的护城河,这是衡量一个公司是不是好公司的重要因素。因为资本是逐利的,护城河越高,造血能力越强,有利润的地方,资本都会一拥而上。市场对Robotaxi的热情高涨,自马斯克4月份宣布以来,特斯拉股价已经上涨近50%,帮助遏制了自年初下跌约35%的趋势。因此本次Robotaxi发布会后股价要涨,马斯克就需要说服投资者特斯拉仍然是创新的温床,就至少要展示一辆实物自动驾驶出租车,说明无人监管的驾驶服务面世时间节点,以及解释特斯拉将如何通过自动驾驶出租车赚钱,另外公司也预计于2025年推出Model 2 Redwood车型,这一款售价不到3万美元的低价汽车有助于扩大特斯拉可销售客群和市场。免责声明:GO Markets 分析师或外部发言人提供的信息基于其独立分析或个人经验。所表达的观点或交易风格仅代表其个人;并不代表 GO Markets 的观点或立场。联系方式:墨尔本 03 8658 0603悉尼 02 9188 0418中国地区(中文) 400 120 8537中国地区(英文) +248 4 671 903作者:
Christine Li | GO Markets 墨尔本中文部

The information provided is of general nature only and does not take into account your personal objectives, financial situations or needs. Before acting on any information provided, you should consider whether the information is suitable for you and your personal circumstances and if necessary, seek appropriate professional advice. All opinions, conclusions, forecasts or recommendations are reasonably held at the time of compilation but are subject to change without notice. Past performance is not an indication of future performance. Go Markets Pty Ltd, ABN 85 081 864 039, AFSL 254963 is a CFD issuer, and trading carries significant risks and is not suitable for everyone. You do not own or have any interest in the rights to the underlying assets. You should consider the appropriateness by reviewing our TMD, FSG, PDS and other CFD legal documents to ensure you understand the risks before you invest in CFDs. 免责声明:文章来自 GO Markets 分析师和参与者,基于他们的独立分析或个人经验。表达的观点、意见或交易风格仅代表作者个人,不代表 GO Markets 立场。建议,(如有),具有“普遍”性,并非基于您的个人目标、财务状况或需求。在根据建议采取行动之前,请考虑该建议(如有)对您的目标、财务状况和需求的适用程度。如果建议与购买特定金融产品有关,您应该在做出任何决定之前了解并考虑该产品的产品披露声明 (PDS) 和金融服务指南 (FSG)。
.jpg)
.jpg)
.jpg)


