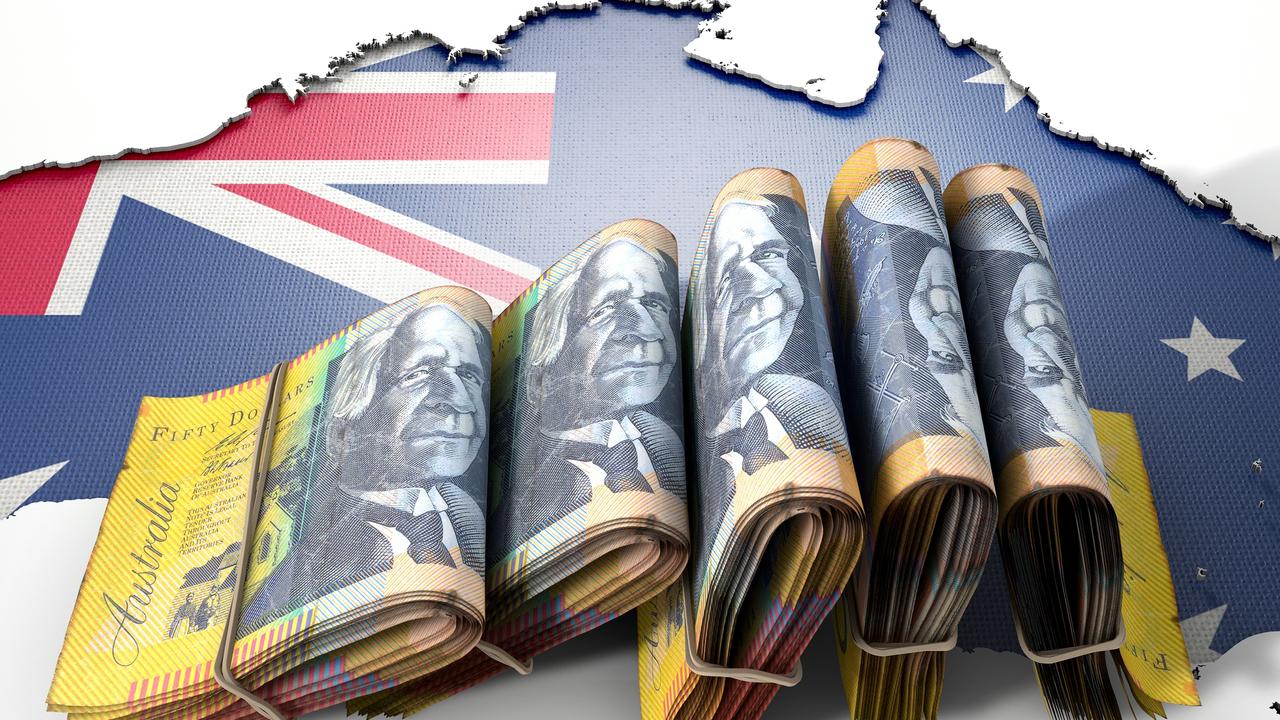
连锁反应:从超市货架到资本市场澳元贬值的影响正在向实体经济渗透。在悉尼的加油站,91号汽油价格突破每升2.3澳元,半年内上涨23%;超市巨头Woolworths警告称,进口食品价格可能进一步上涨5%-7%。对于企业而言,汇率波动带来冰火两重天:矿业公司必和必拓、力拓因出口价格竞争力提升而受益,其美元计价的铁矿石收入兑换成澳元后利润增厚;但航空公司面临燃油成本飙升的压力,澳洲航空(Qantas)1月运营成本同比增加35%,不得不考虑缩减航班。资本市场同样呈现分化。澳大利亚S&P/ASX 200指数中,资源板块年初至今上涨12%,而零售和航空板块下跌8%。这种割裂反映出投资者对经济前景的矛盾心态——既期待出口提振,又担忧国内通胀和消费萎缩。对冲基金开始调整策略,部分机构通过做空澳元/日元交叉盘对冲风险,另一些则押注锂矿股的触底反弹。未来路径:三个关键变量美联储的政策转向对于澳元来说是十分重要的影响因素,历史数据显示,当澳美利差超过100个基点时,澳元贬值压力会显著加剧。作为投资者需密切关注每月非农就业和通胀数据,关注美联储的每一次利率会议。而关于中国,2025年3月的全国两会将成为重要观察窗口。如果中国推出大规模基建计划或房地产救助政策,可能短期内提振铁矿石需求。但目前市场对刺激力度持谨慎态度,高盛报告指出,中国更可能通过新能源和高端制造投资拉动经济,这对澳洲锂矿出口的带动作用有限。除此之外,RBA正面临两难困境:降息可能缓解房贷压力,但会加剧资本外流;维持高利率虽有利于汇率稳定,却可能进一步抑制消费。多数经济学家预测,RBA将在2025年5月首次降息25个基点,但若澳元贬值速度过快,央行可能通过外汇干预手段稳定市场。免责声明:GO Markets 分析师或外部发言人提供的信息基于其独立分析或个人经验。所表达的观点或交易风格仅代表其个人;并不代表 GO Markets 的观点或立场。联系方式:墨尔本 03 8658 0603悉尼 02 9188 0418中国地区(中文) 400 120 8537中国地区(英文) +248 4 671 903作者:Yoyo Ma | GO Markets 墨尔本中文部
By
Yoyo Ma
The information provided is of general nature only and does not take into account your personal objectives, financial situations or needs. Before acting on any information provided, you should consider whether the information is suitable for you and your personal circumstances and if necessary, seek appropriate professional advice. All opinions, conclusions, forecasts or recommendations are reasonably held at the time of compilation but are subject to change without notice. Past performance is not an indication of future performance. Go Markets Pty Ltd, ABN 85 081 864 039, AFSL 254963 is a CFD issuer, and trading carries significant risks and is not suitable for everyone. You do not own or have any interest in the rights to the underlying assets. You should consider the appropriateness by reviewing our TMD, FSG, PDS and other CFD legal documents to ensure you understand the risks before you invest in CFDs. 免责声明:文章来自 GO Markets 分析师和参与者,基于他们的独立分析或个人经验。表达的观点、意见或交易风格仅代表作者个人,不代表 GO Markets 立场。建议,(如有),具有“普遍”性,并非基于您的个人目标、财务状况或需求。在根据建议采取行动之前,请考虑该建议(如有)对您的目标、财务状况和需求的适用程度。如果建议与购买特定金融产品有关,您应该在做出任何决定之前了解并考虑该产品的产品披露声明 (PDS) 和金融服务指南 (FSG)。
If you have ever wondered why a forex pair moves sharply on a single Tuesday afternoon, the answer often sits inside one number: the cash rate.
On 5 May 2026, the Reserve Bank of Australia (RBA) raised its cash rate target by 25 basis points (bps) to 4.35%. The decision unwound much of the easing cycle traders had spent the previous year debating. Markets repriced quickly, and the Australian dollar moved against major peers as traders digested the decision.
When one rate decision changes the market mood
For new traders, decisions like this can feel chaotic.
The chart moves before the headline finishes loading. Spreads widen. Stop levels can be tested in seconds. The financial media then fills with confident takes that often disagree with one another.
This playbook is designed to help you make sense of that chaos. Not by predicting the next move, but by understanding how the cash rate works, how it can ripple through markets, and how to prepare a process before the next decision lands.
Important
This article is general market commentary and education only. It does not constitute personal financial advice. Trading CFDs carries significant risk and may not be suitable for everyone.
Part 01
The 101 explainer
Build a clear, foundational understanding before going anywhere near a setup.
The Basics
What the cash rate is, in plain English
The cash rate is the interest rate that commercial banks charge each other for overnight, unsecured loans. The cash rate target is the level a central bank officially sets to steer that market.
In Australia, the RBA sets the cash rate target to manage inflation and employment. While the names vary, each acts as an anchor for the following equivalents:
United States: Federal Funds Rate
United Kingdom: Bank Rate
Eurozone: Main Refinancing Rate
New Zealand: Official Cash Rate
A simple way to think about it is as the wholesale price of money. When that wholesale price rises, the retail prices linked to it, such as mortgage rates, business loans, savings rates and bond yields, often move higher too. When it falls, borrowing costs across the economy tend to ease.
For traders, this is the macro anchor. It is not just a number on an economic calendar; it influences currencies, indices, commodities, and yield-sensitive stocks.
Where the world's major policy rates sit in May 2026
Headline cash rate equivalents at major central banks, expressed in per cent.
Illustrative
Source. Reserve Bank of Australia, US Federal Reserve, Bank of England, European Central Bank, Bank of Japan and Reserve Bank of New Zealand official statements, figures as at May 2026. Educational illustration.
Why It Matters
Why the cash rate matters more than new traders expect
Central bank decisions are among the most closely watched events on the market calendar. That is because one rate decision can influence several markets at once, from currencies and bond yields to share indices, commodities and the cost of holding leveraged positions overnight.
It affects more than currencies
For CFD traders, this matters for two main reasons. First, leverage can magnify both gains and losses when markets are volatile. Around a central bank decision, price can move quickly, spreads can widen and risk controls become especially important.
It can change holding costs
Second, the swap or holding cost on a CFD position is linked to the underlying cash rate. When rates change, the cost of carrying a position overnight may also change. For example, a pair like AUD/JPY can behave differently when the yield gap between Australia and Japan is wide compared with when it is narrow.
Markets can reprice quickly
New traders often underestimate how fast markets can react. A central bank can shift expectations with one sentence in a statement or press conference.
Markets do not wait for the next quarterly review. They often adjust as soon as the message changes.
Vocabulary
The key terms to know
You do not need to memorise every term in this list. These are the ones that come up most often around cash rate decisions.
Cash rate target
The interest rate level set by a central bank to anchor the economy.
Basis points (bps)
1bp = 0.01%. A 25bps move is a 0.25% change in rates.
Repricing
Markets adjusting expectations instantly after new info.
Hawkish vs Dovish: Hawkish leans toward higher rates (supports currency); Dovish leans toward lower rates (weighs on currency).
Yield Differential: The rate gap between two economies that drives capital flows.
Carry trade
Investing in high-yield via low-yield borrowing.
Risk-on/off
Market mood favouring growth vs safe-havens.
Trimmed Mean
Inflation measure that filters out volatile price swings.
Swap or Rollover:
The overnight interest charge/credit for leveraged positions.
Watch for triple swaps on Wednesdays which account for weekend settlement.
Position Sizing
What a 25 bps move may cost you
Basis points can sound abstract until you connect them to position size. Here is a simplified way to show why a small percentage move can matter for a CFD trader. A standard one-lot position in major FX is 100,000 units of the base currency and a 25 bps shift in the underlying cash rate is 0.25% per year.
The point is not the exact cents. It is that small-sounding percentage changes can compound on leveraged positions held for weeks or months.
Position size
Annual exposure to a 25 bps shift
Approximate daily impact
Standard lot, 100,000 units
About 250 units
About 0.68 units
Mini lot, 10,000 units
About 25 units
About 0.07 units
Micro lot, 1,000 units
About 2.50 units
About 0.01 units
Note. Figures are illustrative and shown in the quote currency of the pair. Educational illustration only.
How it works in real market conditions
A central bank decision is rarely just about the rate change itself. The market reaction is shaped by three layers: the decision, the statement, and any press conference or projections.
On 5 May 2026, the RBA raised the cash rate to 4.35%. While the hike was the headline, the statement and subsequent press conference provided the context that allowed markets to reprice bond yields and currency pairs in real time.
AUD/USD often spikes, fades, then trends after a rate decision
Stylised intraday reaction in the first 90 minutes around a hawkish RBA surprise.
Illustrative
Source. Stylised illustration based on typical post-decision price behaviour. Educational purposes only. Liquidity can shift quickly: In the first 5 to 15 minutes after a decision, spreads can widen and fills can slip. High-frequency systems can digest language faster than humans, and mean reversion is common before a clearer trend emerges.
Market Dynamics
How central banks ripple across assets
Cash rate decisions rarely affect one market in isolation. They trigger a domino effect through currencies, yields, and volatility at varying speeds.
This kind of sector dispersion is not just an equities story. The same monetary tightening can produce sharply different outcomes across consumer segments, business sizes and parts of the wider economy, a dynamic sometimes called a K-shaped economy.
Major FX pairs
AUD/USD, EUR/USD, and JPY crosses respond directly to yield differentials.
Short-end yields
The 2-year government bond often acts as a leading indicator for currency moves.
Stock indices
High rates discount future earnings, weighing heavily on growth and tech names.
Gold & safe havens
Bullion reacts to real yields and the USD; hawkish shifts usually pressure gold prices.
Energy markets
Prices feed into inflation expectations, creating a feedback loop for central bank policy.
Market dispersion
When index components move in opposite directions following a rate change.
A tightening cycle can split the ASX 200
Illustrative
Stylised illustration of sector dispersion through a tightening cycle, with index levels rebased to 100.
Source. Stylised illustration based on typical sector behaviour during tightening cycles. Outcomes vary by cycle. Educational purposes only.
The Beginner Trap
What many new traders miss
Markets react to the gap between expectations and reality. A hike that is fully priced in can lead to a falling currency; a hold with hawkish guidance can trigger a rally. The chart is only one part of the story. The setup may look simple, but the risk rarely is.
"Success in these events comes from understanding what is already priced in, and what would change the view if it does not play out that way."
Common mistakes to avoid
• Trading headlines: The initial print is often misleading. Wait for the second wave (statement/press conference).
• Binary leverage: Volatility hits stops harder. Scale risk down into known event risks.
• Chasing moves: Entering late usually means buying exhaustion. Wait for clear retracements.
• Narrative vs. trade: A clear story doesn't guarantee a setup. Ask: "What is already in the price?"
• Indicator myopia: No single signal captures global flows. Watch yields and cross-asset confirmation.
• No Invalidation: Without a clear "I am wrong" level, traders hold losing positions far too long.
Next Strategic Step
Master the volatility cycle
Understanding how the cash rate moves the market is only half the battle. Learn how to read the "Fear Gauge" to identify when volatility creates high-probability entry points.