The information provided is of general nature only and does not take into account your personal objectives, financial situations or needs. Before acting on any information provided, you should consider whether the information is suitable for you and your personal circumstances and if necessary, seek appropriate professional advice. All opinions, conclusions, forecasts or recommendations are reasonably held at the time of compilation but are subject to change without notice. Past performance is not an indication of future performance. Go Markets Pty Ltd, ABN 85 081 864 039, AFSL 254963 is a CFD issuer, and trading carries significant risks and is not suitable for everyone. You do not own or have any interest in the rights to the underlying assets. You should consider the appropriateness by reviewing our TMD, FSG, PDS and other CFD legal documents to ensure you understand the risks before you invest in CFDs. These documents are available here.
Any references to Australian or international shares, sectors, indices, ETFs, crypto-related stocks or other instruments are provided for market commentary and watchlist purposes only and do not constitute a recommendation, offer or solicitation to buy, sell or hold any financial product or adopt any investment strategy. International markets may involve additional risks, including currency fluctuations, regulatory differences, market structure differences, reduced liquidity and higher volatility. Company-specific, sector-specific and macroeconomic risks may also affect performance.
Commentary on geopolitical developments, economic data, central bank decisions, earnings, policy changes and other global or financial market events is based on information available at the time of publication and may change without notice. Such events can lead to sudden market moves, price gaps, reduced liquidity, wider spreads and increased volatility, particularly in leveraged products such as CFDs. Forward-looking statements, expectations and scenario analysis are inherently uncertain and should not be relied on as guarantees of future market behaviour or outcomes.
Prakiraan Harga GBP/JPY: Bullish Harami Menguji Resistance 213,00

- GBP/JPY membentuk potensi bullish harami, menandakan minat kenaikan yang kembali.
- RSI yang meningkat mendukung pemulihan, namun pertemuan SMA di 212,92-213,02 membatasi kenaikan.
- Penembusan di atas 213,02 membuka peluang menuju 216,62 dan resistance psikologis di 217,00.
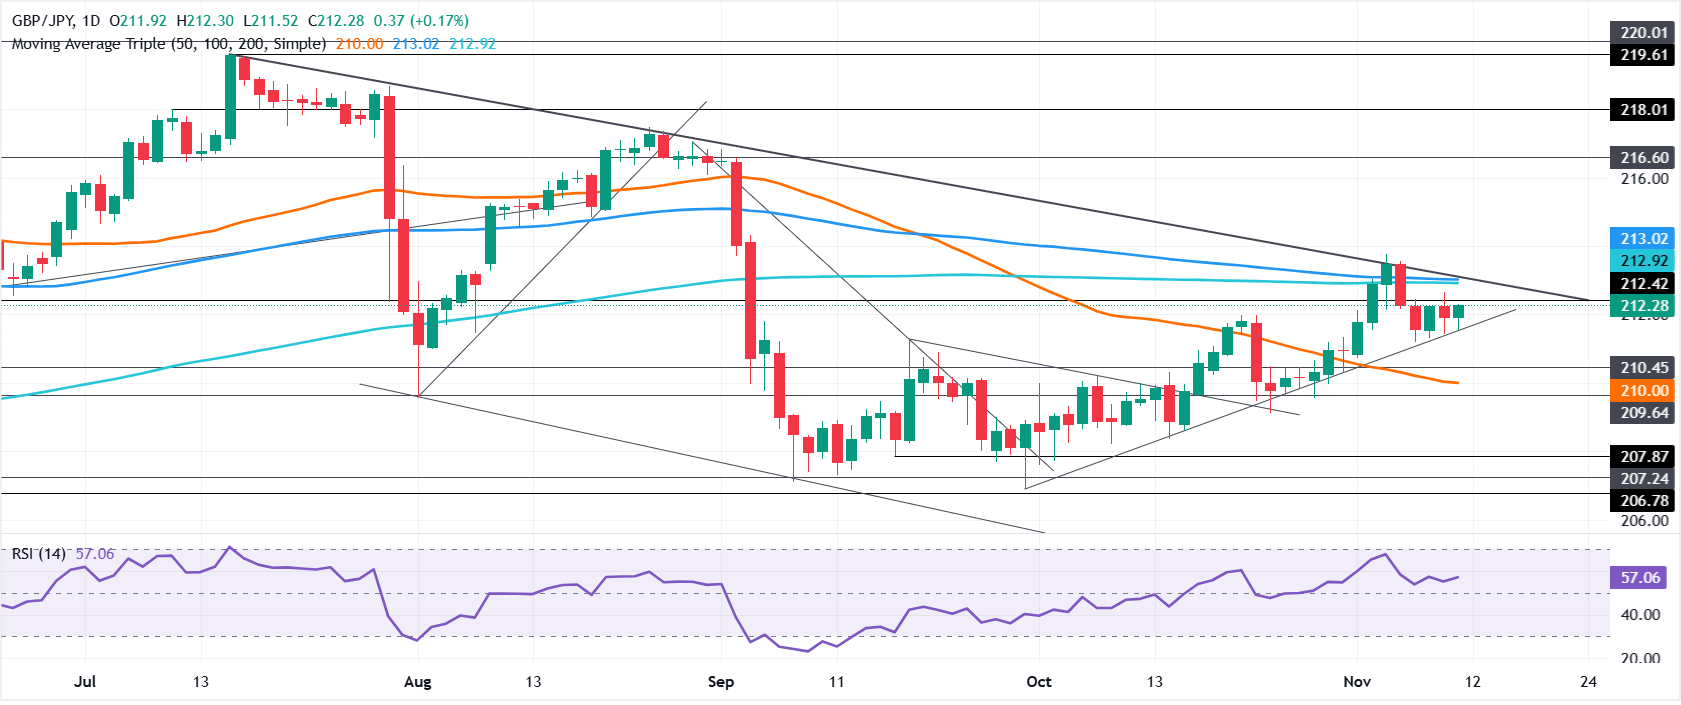
GBP/JPY diperdagangkan secara bergejolak meskipun membukukan kenaikan 0,17% pada hari Rabu, dengan pergerakan harga tetap berada dalam kisaran harian Selasa di 211,44-212,65, yang mengindikasikan bahwa pola ‘bullish harami’ atau inside day berpotensi terbentuk di dekat area resistance utama.
Prakiraan Harga GBP/JPY: Prospek teknis
Perlu dicatat, GBP/JPY bangkit setelah menguji garis tren support utama di dekat 211,33 pada hari Senin, membuka peluang untuk pemulihan. Namun, para pembeli tetap enggan menempatkan taruhan baru karena resistance utama muncul pada pertemuan Simple Moving Average (SMA) 100-hari dan 200-hari di 212,92 dan 213,02, masing-masing. Jika GBP/JPY melewati level tersebut, pemberhentian berikutnya adalah level tertinggi 2 September di 216,62, sebelum para pembeli menguji level 217,00,
Pada sisi negatifnya, support pertama untuk GBP/JPY adalah level terendah hari Senin (LOD) di 211,33, diikuti oleh level psikologis 211,00. Pemberhentian berikutnya adalah SMA 50-hari di 210,00.
Dari perspektif momentum, kenaikan lebih lanjut terlihat karena Relative Strength Index (RSI) bullish dan mengarah ke atas.
Grafik Harga GBP/JPY – Harian
Harga Yen Jepang Hari Ini
Tabel di bawah menunjukkan persentase perubahan Yen Jepang (JPY) terhadap mata uang utama yang terdaftar hari ini. Yen Jepang adalah yang terkuat melawan Franc Swiss.
| USD | EUR | GBP | JPY | CAD | AUD | NZD | CHF | |
|---|---|---|---|---|---|---|---|---|
| USD | 0.63% | 0.50% | 0.67% | 0.41% | 0.22% | 0.67% | 0.92% | |
| EUR | -0.63% | -0.12% | 0.05% | -0.22% | -0.40% | 0.05% | 0.29% | |
| GBP | -0.50% | 0.12% | 0.17% | -0.09% | -0.28% | 0.17% | 0.42% | |
| JPY | -0.67% | -0.05% | -0.17% | -0.26% | -0.44% | 0.02% | 0.25% | |
| CAD | -0.41% | 0.22% | 0.09% | 0.26% | -0.18% | 0.27% | 0.51% | |
| AUD | -0.22% | 0.40% | 0.28% | 0.44% | 0.18% | 0.45% | 0.70% | |
| NZD | -0.67% | -0.05% | -0.17% | -0.02% | -0.27% | -0.45% | 0.22% | |
| CHF | -0.92% | -0.29% | -0.42% | -0.25% | -0.51% | -0.70% | -0.22% |
Heat Map menunjukkan persentase perubahan mata uang utama terhadap satu sama lain. Mata uang dasar diambil dari kolom kiri, sedangkan mata uang pembanding diambil dari baris atas. Misalnya, jika Anda memilih Yen Jepang dari kolom kiri dan berpindah sepanjang garis horizontal ke Dolar AS, persentase perubahan yang ditampilkan dalam kotak akan mewakili JPY (dasar)/USD (pembanding).
Related Articles