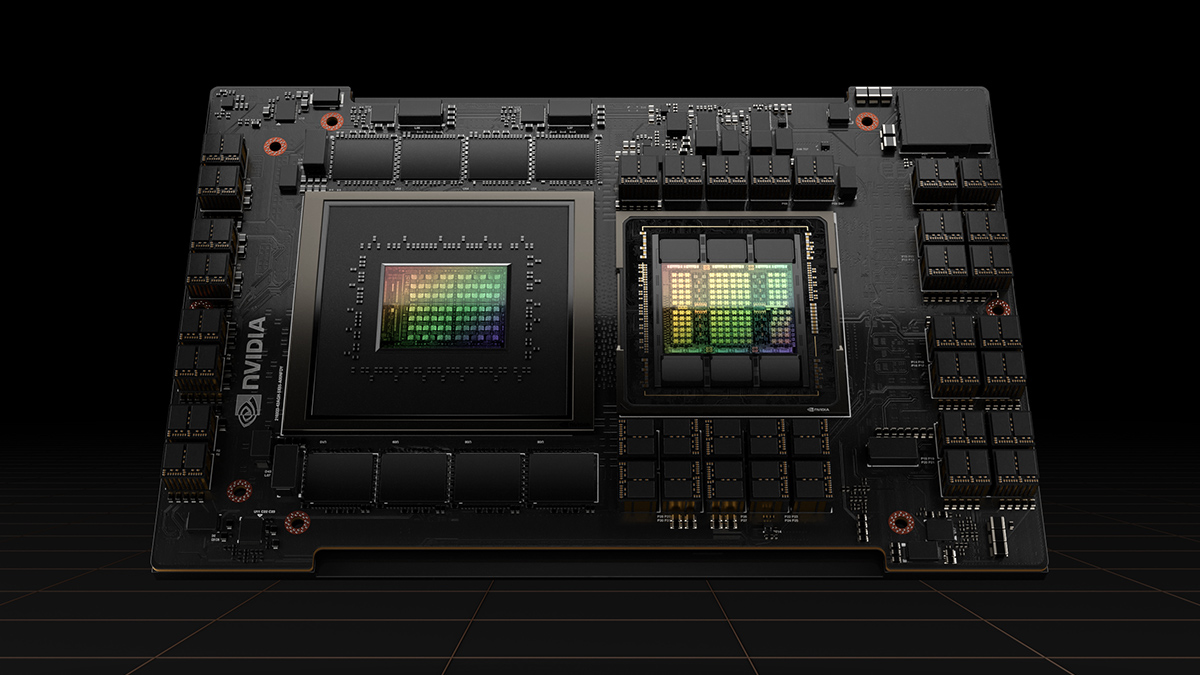
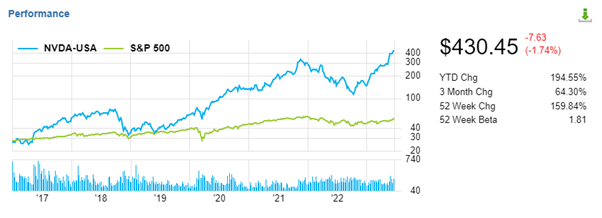
热门话题在Ai大火的加成下,英伟达H100芯片成为了时下流行的GPU。其风头一度盖过了英伟达一直以来的主要产品,GeForce GPU(也就是我们常说的独立显卡)。这波浪潮中,火热的不仅仅只有产品,还有其公司的股价。英伟达股价在今年可谓是坐过山车一般的飙升,近3个月变化为64.3%,近52周变化为159.84。遥想在去年科技股重创,其股价在10月份一度跌至124美元。仅仅半年多时间,现在股价已经涨至430美金/股。
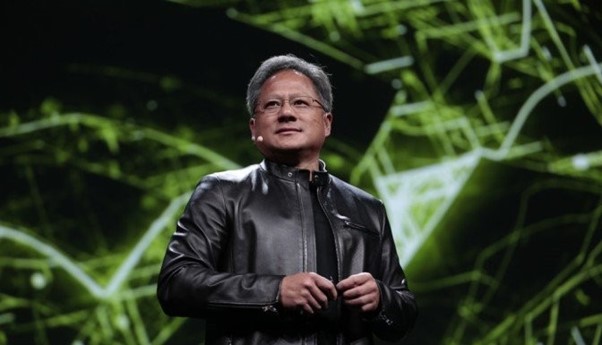
(Source:NVIDIA)在ChatGPT出现的时候,笔者就开始推荐NVIDIA的股票,当时分析到了AI对于英伟达会产生推动作用,接着评估了其良好财报,对其股价做一系列估值,再加上对于英伟达产品一种信仰(基本上其每代产品都有认真体验过),还有就是对于老黄作为领导者的肯定。于是英伟达也没有让我们失望,在科技元年下爆发式增长,并且成功的让市值突破了一万亿。
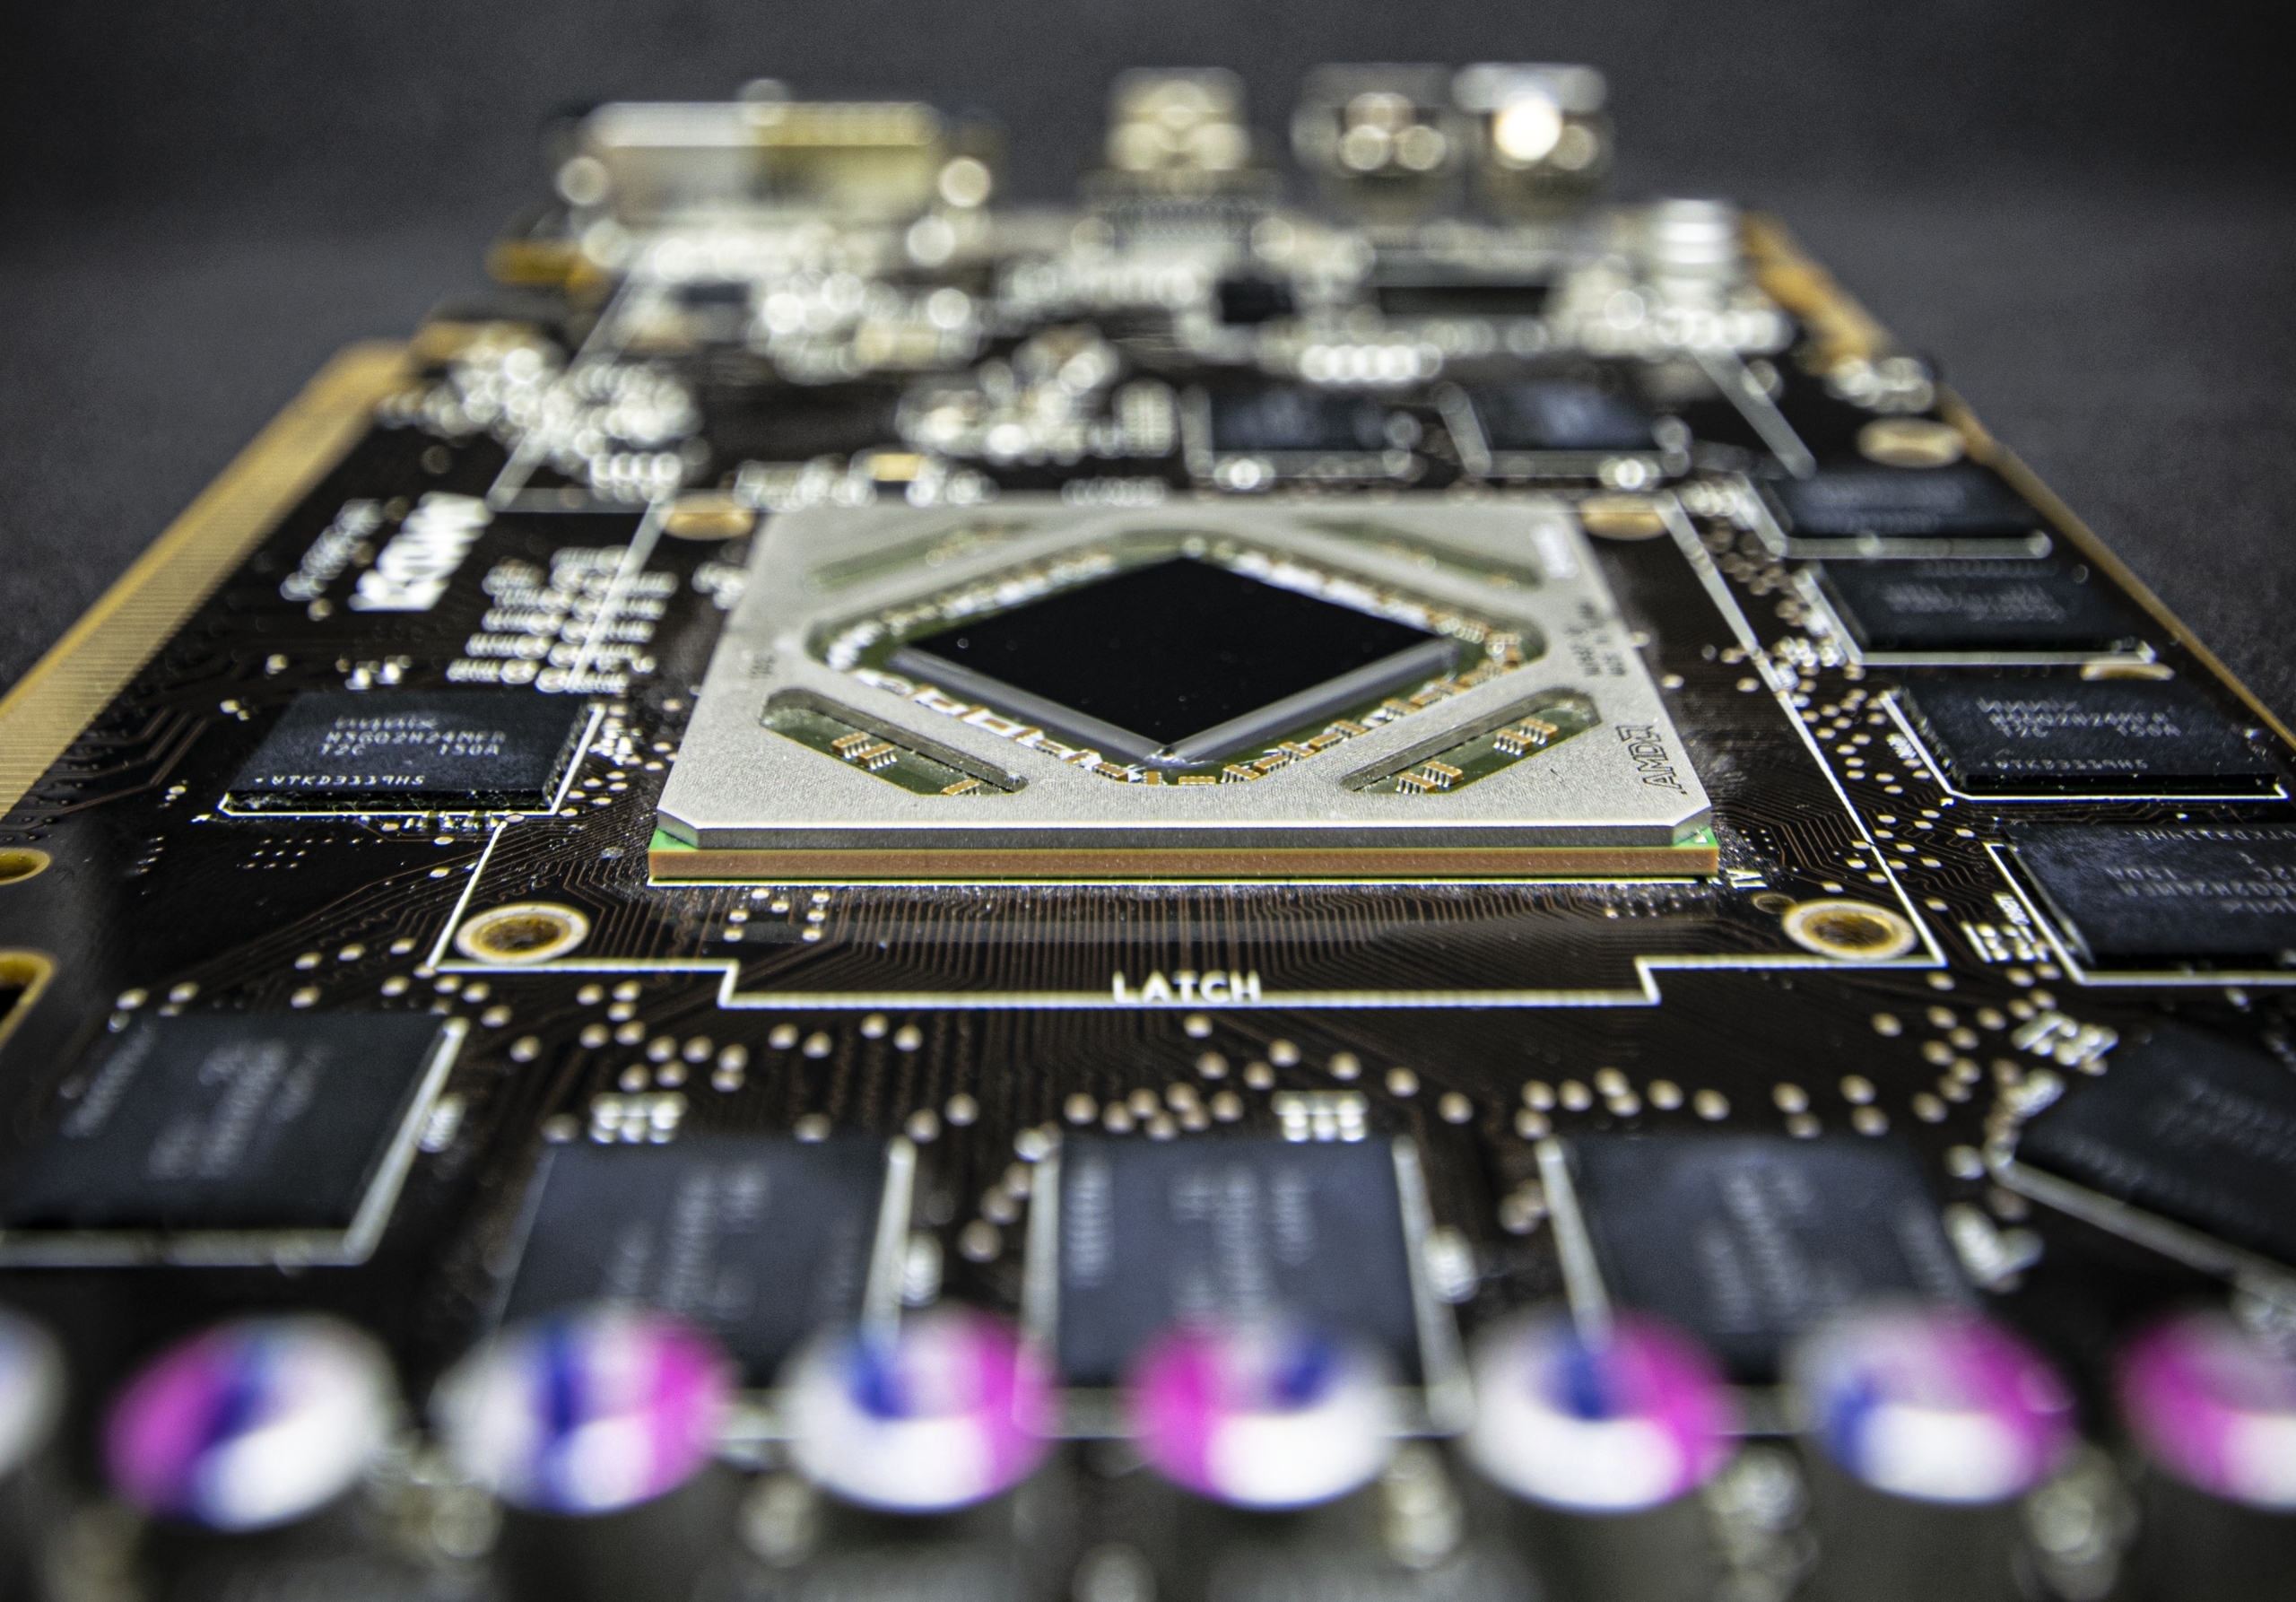
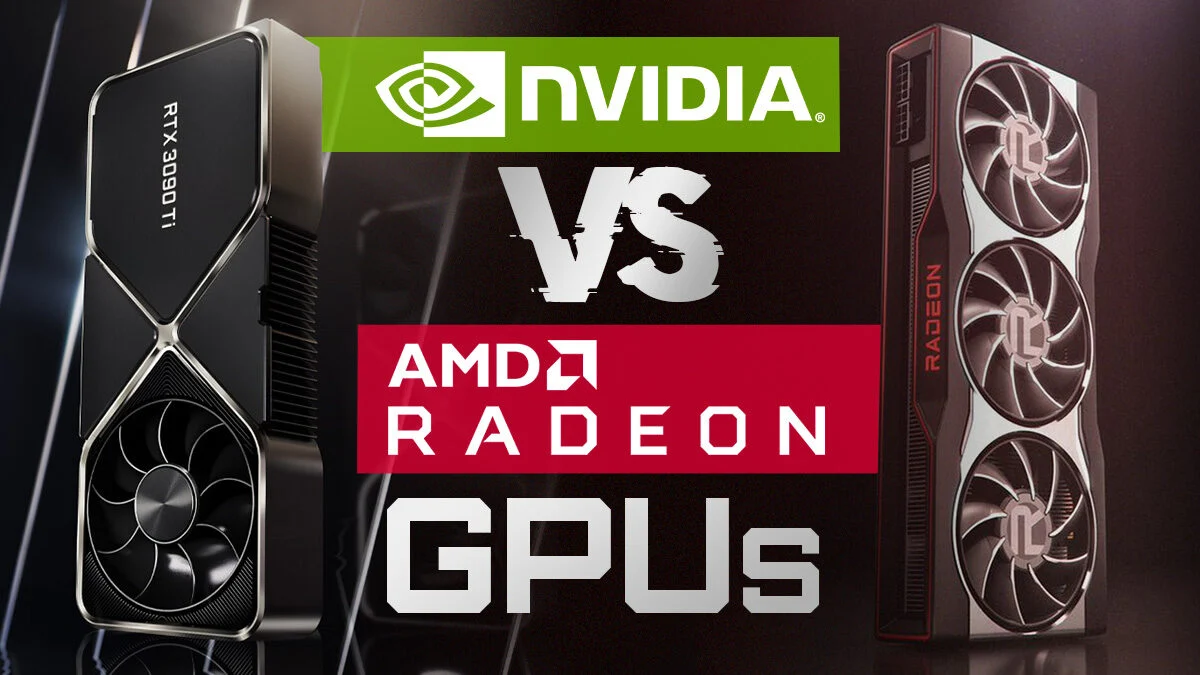
目前英伟达主要的产品线是GPU。GPU包括面向游戏玩家的GeForce、面向设计师的Quadro、面向 AI 数据科学家和大数据研究人员的Tesla 和 DGX,以及面向基于云的视觉计算用户的GRID。别看现在有那么多产品,其实在两家争霸的时期,最多的竞争还是游戏显卡的竞争。那么目前来说,英伟达真正以上的竞争者只剩下了AMD一家。(intel也算,吧?)那么目前的两强争霸局势怎么形成的呢?
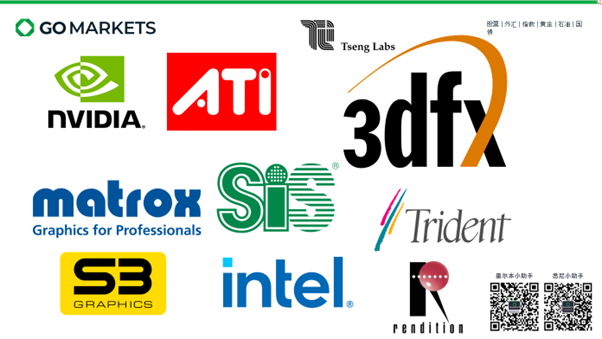
(Source:cgdirector)其实两强争霸已经持续了20年了,但是在90年代,情况那可以复杂的多。当年的可谓是五代十国时期。NVIDIA,ATI Technologies(AMD前身),3dfx Interactive,Matrox,S3 Graphics,Silicon Integrated Systems (SiS),Trident Microsystems,Cirrus Logic,Tseng Labs,Rendition。在当年都是赫赫有名的显卡厂商,随便拉出来一个都是很能打的存在。
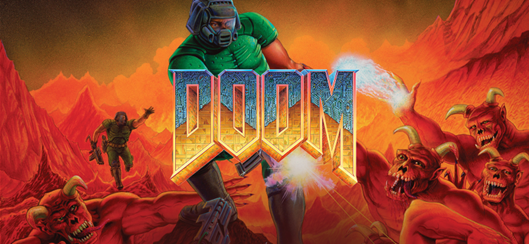
这里就不得不说一下,90年代到底发生了什么,让这些厂商如雨后春笋般冒了出来。那么我们就回到90年代,看一看当年“真刀真枪”的战斗。这场大战的主要载体是什么呢?不是特效制作,不是建模,没错,是游戏。在80年代,涌现出很多2D像素风的游戏,坦克大战呀,超级马里奥都是我们这代人的记忆。到了90年代,因为技术的进步,观念的进步,游戏有意思不仅仅是绝对标准了,还需要“好看”。画面效果也成了吸引人的关键。于是,一系列的3D游戏就开始出现。然而在1993年有一款3D游戏改变了这个世界。那就是鼎鼎大名的《Doom》"Doom"是由id Software开发并于1993年发布的一款开创性的第一人称射击游戏。为第一人称射击游戏(FPS)树立了新的标准,并引入了一种新的多人游戏模式,叫做"死亡竞赛"。此外,id Software还鼓励玩家创造并分享他们自己的"Doom"关卡,这一概念现在被称为"MOD"。
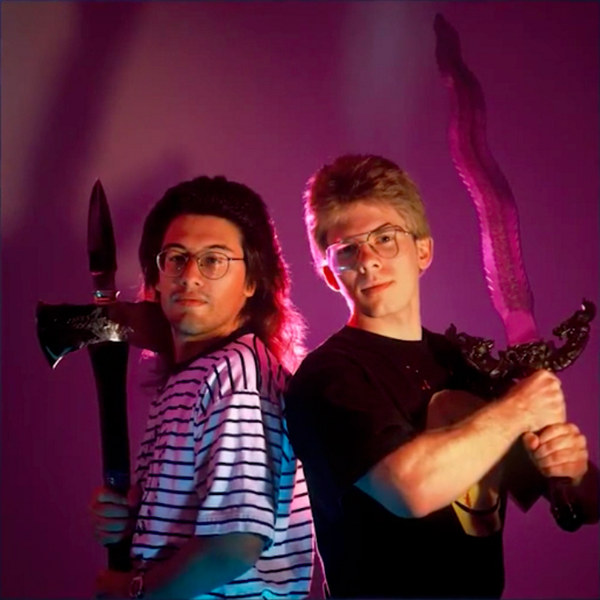
Doom游戏是由id software的天才程序员John Carmack和John Romero联合开发的。这里还提一下,在2013年离开id Software后,Carmack加入了Oculus VR,成为了其首席技术官。于是我们现在才可以用上Oculus quest 2那么好的VR产品。Doom,音乐,画面都是一流,再加上快节奏,爽的玩法,迅速成为了所有电脑玩家的新宠。也成为了3D游戏的领导者。而这还不算完,之后Id software 在1996 年更是推出了Quake这个游戏,并且改变了整个游戏行业。其中包括团队死斗模式的加入,创造了第一批电竞 。其中包括催生出了我们熟悉的WASD游戏键位。Quake引擎是游戏开发的一次重大突破。它是第一个真正的全3D游戏引擎,允许复杂的环境、物体和角色以全3D的方式渲染和动画化。此前的游戏,如"Doom",虽然使用了3D视觉效果,但实际上是2.5D的。Quake引擎还支持网络多人游戏,并且通过使用客户端/服务器模型来减少延迟,这在当时是革新性的。这一模型使得玩家能够在网络上进行平滑且响应快速的游戏。Quake引擎在之后的数年里被广泛用于其他游戏的开发,包括"Half-Life"、"Call of Duty"和"Medal of Honor"等系列。
Quake的出现,也造成另一个问题,这个游戏太超前了,硬件,有些跟不上了。CPU已经无法满足需求了。只有当年的顶级CPU,例如奔腾系列才可以跑得动。但是价格实在是太高昂了。再加上CPU面对复杂场景算力需求实在难以满足,于是催生出了第一代的显卡,放在当年,是叫图形加速卡。(谁也没想到,当年只是用来分担苦工的显卡,在时至今日的PC端,肩负起了重任。)在这个时候,当年的老大哥3dfx出现了。3dfx是由Silicon Graphics的三个年轻人Ross Smith,Scott Sellers和Gary Tarolli创建。(Silicon Graphics是图形工作站企业,在90年代初,SGI几乎垄断了高端3D图形市场,许多电影视觉效果,如《侏罗纪公园》和《泰坦尼克号》,都使用SGI的技术。)作为一个初创公司,吸引投资是很重要的,当年他们也很聪明,说一堆专业名词没有用,给投资人看到效果才是真的。于是硅谷名言就这么产生了“fake it until make it”于是在借用Silicon Graphics的工作站做出来吊炸天的3D实时demo后,宣布这将是未来消费级芯片可以做出来的效果。于是在这样半真半“骗”下,3dfx拉来了巨大赞助投资。最终也是不负众望,3dfx制造出来的芯片真的跑动了曾经用工作站才可以跑出了的demo。在1996年,历史里程碑式产品出现了----Voodoo加速卡,超越对手,价格低于高端cpu。并且在强势期,市场占有率达到了85%。和今天的英伟达可谓是十分相似。
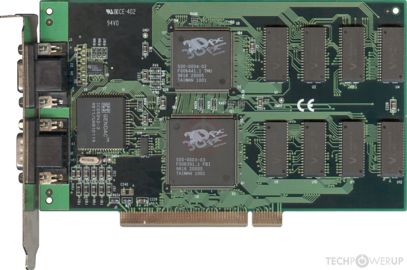
(Source:techpowerup)1997年Voodoo 2 出现,也成为了3dfx最成功的产品,并且支持sli。当然了,售价也不便宜。在如此Buff加成下,3dfx理应一路披荆斩棘,成为“爸爸”级别的企业。但是如今,大多数人听都没有听到这个公司了。那么下一期,我们将会聊一聊,3dfx如何失败的,英伟达又是如何成功的?对于我们目前分析企业,投机逻辑中特别是基本面分析有什么可借鉴的地方?我们下一期将会讲述英伟达的崛起,欢迎大家留言,讨论,我们下期再见。免责声明:GO Markets分析师或外部发言人提供的信息基于其独立分析或个人经验。所表达的观点或交易风格仅代表其个人;并不代表GO Markets的观点或立场。联系方式:墨尔本 03 8658 0603悉尼 02 9188 0418中国地区(中文) 400 120 8537中国地区(英文) +248 4 671 903作者:Neo Yuan | GO Markets 分析师

The information provided is of general nature only and does not take into account your personal objectives, financial situations or needs. Before acting on any information provided, you should consider whether the information is suitable for you and your personal circumstances and if necessary, seek appropriate professional advice. All opinions, conclusions, forecasts or recommendations are reasonably held at the time of compilation but are subject to change without notice. Past performance is not an indication of future performance. Go Markets Pty Ltd, ABN 85 081 864 039, AFSL 254963 is a CFD issuer, and trading carries significant risks and is not suitable for everyone. You do not own or have any interest in the rights to the underlying assets. You should consider the appropriateness by reviewing our TMD, FSG, PDS and other CFD legal documents to ensure you understand the risks before you invest in CFDs. 免责声明:文章来自 GO Markets 分析师和参与者,基于他们的独立分析或个人经验。表达的观点、意见或交易风格仅代表作者个人,不代表 GO Markets 立场。建议,(如有),具有“普遍”性,并非基于您的个人目标、财务状况或需求。在根据建议采取行动之前,请考虑该建议(如有)对您的目标、财务状况和需求的适用程度。如果建议与购买特定金融产品有关,您应该在做出任何决定之前了解并考虑该产品的产品披露声明 (PDS) 和金融服务指南 (FSG)。