US inflation, crude oil shock, and crypto's breakout: GO Markets week ahead
GO Markets
6/3/2026
•
0 min read
Share this post
Copy URL
US inflation data on Wednesday is the week's centrepiece, but with oil nearing seven-month highs, Bitcoin (BTC) sentiment shifting, and the Australian dollar at three-year highs, traders have plenty to navigate in the week ahead.
Quick Facts
US inflation rate (February) is the key binary event for rate cut pricing and equity direction.
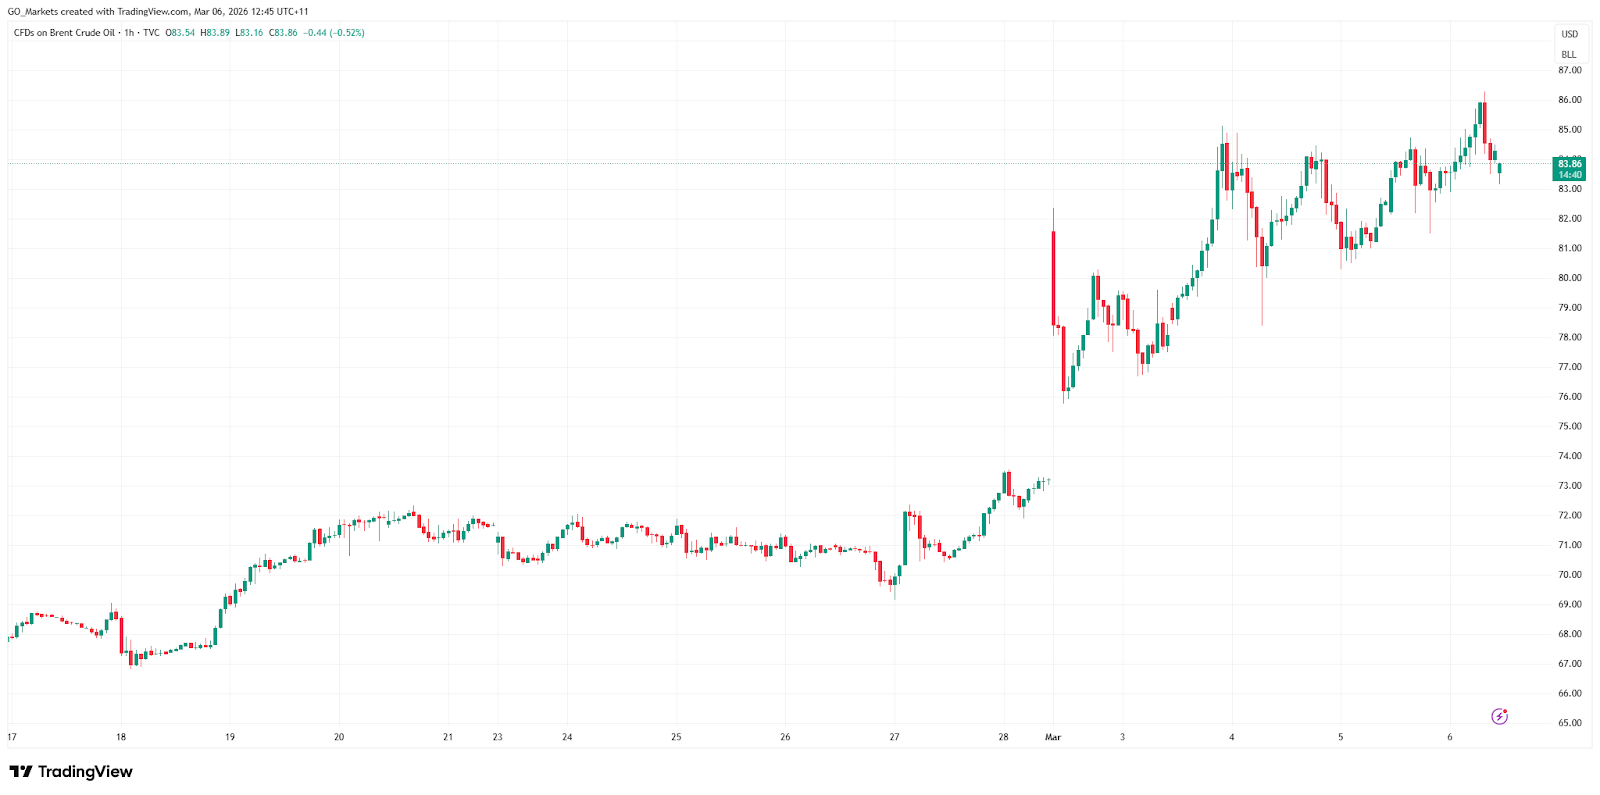
Brent crude is trading around US$82–84/bbl, near seven-month highs, with a $4–$10 geopolitical risk premium baked in from Iran/Hormuz tensions.
Bitcoin is trading above US$70,000 as of 6 March, a potential trend change if it holds through the week.
United States: inflation in focus
Last month’s US inflation reading showed prices rising 2.4% year-on-year, still well above the Fed's 2% target.
February's inflation rate, due Wednesday, will be scrutinised for signs that tariff pass-through or rising energy costs are pushing prices back up, or whether the slow grind lower is still intact.
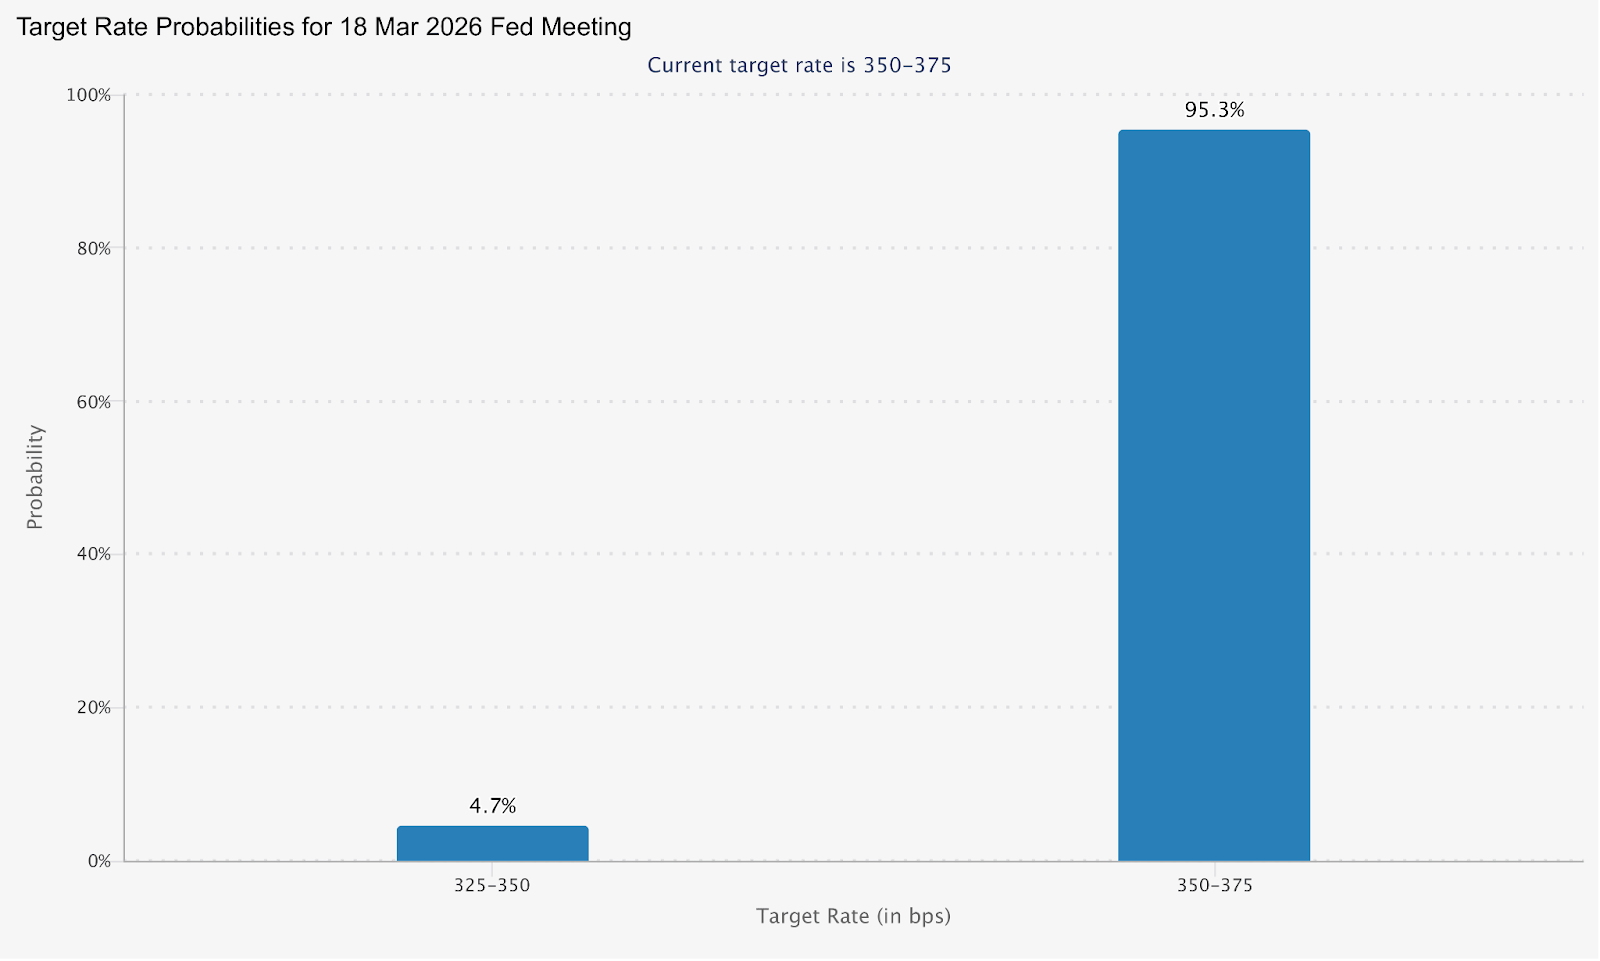
The March FOMC meeting on 17–18 March is now priced at only an 4.7% probability of a cut. A higher-than-expected inflation print this week could potentially push rate cut expectations further out.
A softer read opens the door to renewed cut pricing and potential relief across risk assets.
Key Dates
US Inflation Rate (February CPI): Wednesday 11 March, 12:30 am (AEDT)
Monitor
Core vs. headline inflation divergence as evidence of tariff pass-through in goods prices.
2-year and 10-year treasury yield sensitivity to the print.
USD direction and FedWatch repricing in the lead up to the 18 March FOMC decision.
Target rate probabilities for 18 March FOMC meeting | CME
Oil: elevated and event-sensitive
Brent is currently trading around US$83–85 per barrel, with a 52-week range spanning $58.40 to $85.12, reflecting the dramatic move triggered by the Middle East conflict.
Analysts estimate the geopolitical risk premium already baked into oil at US$4–$10 per barrel, and average 2026 Brent forecasts have been lifted to US$63.85/bbl, up from US$62.02 in January.
The EIA's Short-Term Energy Outlook forecasts Brent to average $58/bbl in 2026, well below the current spot price.
The gap between spot and the forecast baseline could be a useful frame for traders this week: any de-escalation signal from the Middle East could rapidly close that gap.
Monitor
Strait of Hormuz developments and any diplomatic signals from Iran nuclear talks.
EIA weekly oil inventory data.
Oil's knock-on to inflation expectations and whether it shifts central bank posture.
Energy sector equity performance relative to the broader market.
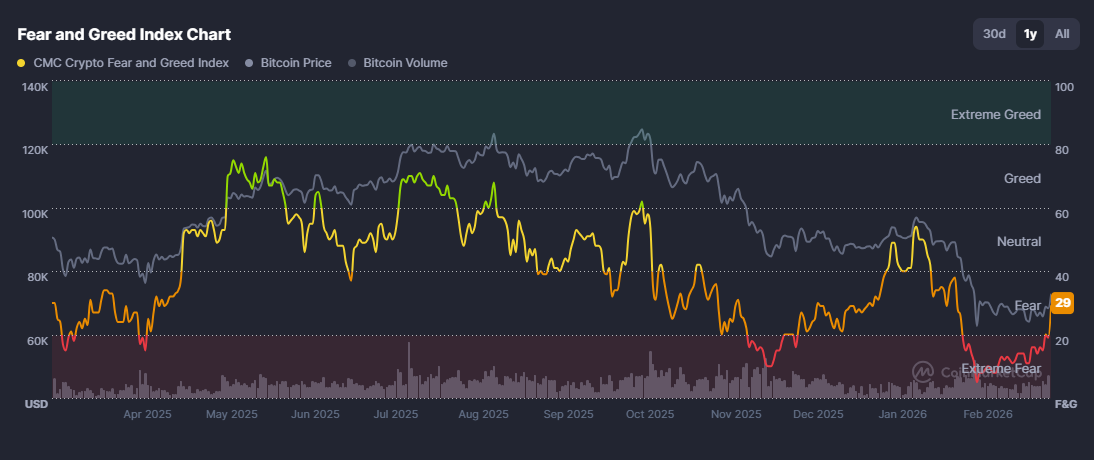
BTC has been attempting to stabilise after a brutal 53% correction over the past 17 weeks, fuelled by escalating geopolitical tensions and renewed tariff concerns.
However, yesterday saw a 8% jump back above $72,000, and the crypto “fear and greed index” jumped up to 29 (fear), up from below 20 (extreme fear), where it has been sitting for over a month, indicating a potential sentiment shift.
A cooler-than-expected US inflation print on Wednesday could provide further fuel for the breakout; a hot print risks potentially pulling BTC back below the US$70,000 level it has just reclaimed.
Monitor
Inflation print reaction on Wednesday as the primary macro catalyst for the move.
Any rotation into altcoins following BTC strength.
ETF inflow/outflow data as confirmation of institutional participation.
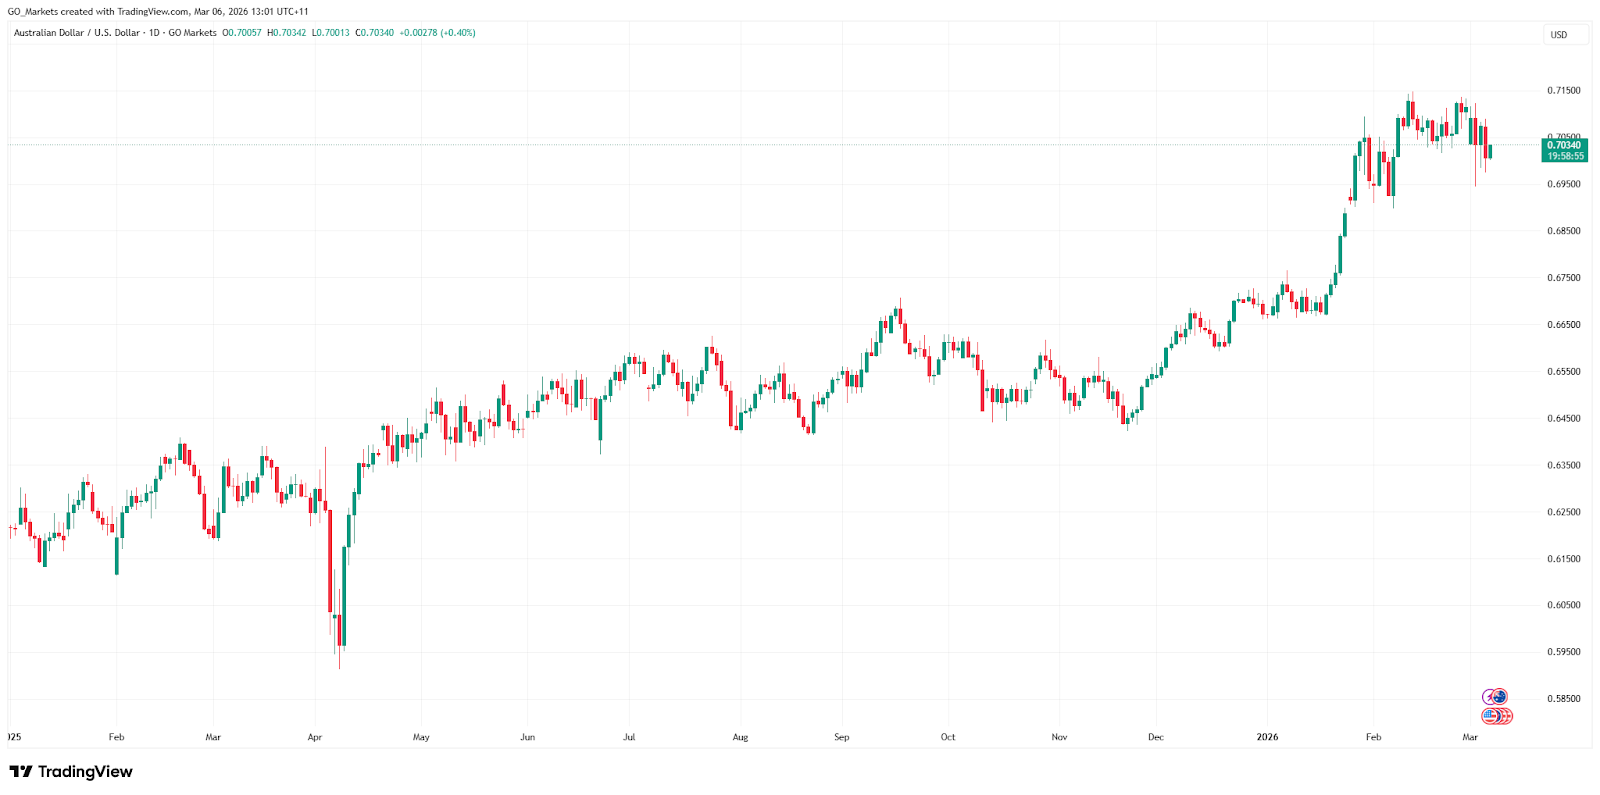
The Aussie is trading near more than three-year highs and heading for its fourth consecutive monthly gain, up more than 6% year-to-date, making it the top-performing G10 currency in 2026.
The driver is a clear policy divergence. RBA Governor Michele Bullock signalled the March policy meeting is "live" for a possible rate increase, and warned that an oil price shock from Iran tensions could reignite domestic inflationary pressures.
Market pricing now suggests around a 28% chance of a 25bp hike at the upcoming meeting, while fully pricing in tightening through May, and around a 75% chance of another increase to 4.35% by year-end.
This hawkish read, set against a Fed on hold and facing dovish political pressure, creates a potential structural tailwind for the Aussie.
Monitor
AUD/USD reaction to Wednesday's US inflation data.
RBA rate hike probability repricing through the week.
Iron ore and commodity prices as secondary AUD drivers.
China demand signals, given Australia's export exposure.
The information provided is of general nature only and does not take into account your personal objectives, financial situations or needs. Before acting on any information provided, you should consider whether the information is suitable for you and your personal circumstances and if necessary, seek appropriate professional advice. All opinions, conclusions, forecasts or recommendations are reasonably held at the time of compilation but are subject to change without notice. Past performance is not an indication of future performance. Go Markets Pty Ltd, ABN 85 081 864 039, AFSL 254963 is a CFD issuer, and trading carries significant risks and is not suitable for everyone. You do not own or have any interest in the rights to the underlying assets. You should consider the appropriateness by reviewing our TMD, FSG, PDS and other CFD legal documents to ensure you understand the risks before you invest in CFDs. These documents are available here. Any references to Australian or international shares, sectors, indices, ETFs, crypto-related stocks or other instruments are provided for market commentary and watchlist purposes only and do not constitute a recommendation, offer or solicitation to buy, sell or hold any financial product or adopt any investment strategy. International markets may involve additional risks, including currency fluctuations, regulatory differences, market structure differences, reduced liquidity and higher volatility. Company-specific, sector-specific and macroeconomic risks may also affect performance.
Commentary on geopolitical developments, economic data, central bank decisions, earnings, policy changes and other global or financial market events is based on information available at the time of publication and may change without notice. Such events can lead to sudden market moves, price gaps, reduced liquidity, wider spreads and increased volatility, particularly in leveraged products such as CFDs. Forward-looking statements, expectations and scenario analysis are inherently uncertain and should not be relied on as guarantees of future market behaviour or outcomes.
The US economy enters June in a complex environment where high interest rates, trade tariff policy and elevated energy prices continue to shape market expectations.
The Asia-Pacific region enters June 2026 navigating a sharp break from traditional economic cycles. Escalating energy costs linked to the Strait of Hormuz managed access regime are colliding with China’s domestic policy shift and Australia’s restrictive monetary stance.
In the "Year of Proof" 2026, the relationship between the US consumer and the Asian producer has entered a period of sharp divergence. Following the US Supreme Court's decision to invalidate previous emergency tariffs, the transition to the Section 122 regime raised the average effective US tariff rate to 10.3%.
Part two of GO's educational series, designed to help new traders understand the key forces that shape global markets.
Every day, traders watch gold, tech stocks and the Australian dollar move, looking for the next catalyst. But behind many major market moves sits another force that can shape direction: bond yields.
Many traders treat bonds as something only institutional investors need to follow. That can leave a major part of the market story out. When yields move, they may change how investors price risk, growth, inflation and the cost of money across almost every market traders watch.
Why bond yields matter
Bond yields are one of the market’s main signals for the cost of money. When yields rise or fall, they can influence currencies, equities, gold and risk appetite because they change how investors value future returns.
At its most basic level, a government bond is a loan from investors to a government.
When an investor buys a bond, they are lending money to that government for a fixed period. In return, the government agrees to pay a fixed amount of interest each year until the bond matures and the original money is returned.
You do not need to trade bonds to understand why they matter. What matters is not only the bond itself, but the return on that bond. That return is called the yield, and it can tell traders how the market is pricing inflation, growth, central bank policy and risk.
When commentators say “yields are rising” or “the yield curve has shifted”, they are usually talking about changes in government bond yields and what those changes may suggest about the broader financial system.
The Lifecycle of a Government Bond
1
The Loan
An investor buys a bond, effectively lending capital to the government for a fixed period.
2
The Interest
The government agrees to pay a fixed, recurring amount of interest every year.
3
Maturity
The bond's term ends, and the government returns the original money to the investor.
The Yield
The actual return an investor makes on this process. It acts as a live market signal for inflation, growth, Fed policy, and risk.
Why bond prices and yields move in opposite directions
This is one of the key concepts to understand: bond prices and bond yields move in opposite directions. When bond prices rise, yields fall. When bond prices fall, yields rise.
It can feel counterintuitive at first, but the mechanism is straightforward once the coupon payment is fixed.
How does it work?
Let’s say an investor buys a new government bond for US$100, and it pays a fixed US$5 interest payment every year. The yield on that investment is 5%.
Now imagine the economy slows and investors seek the perceived safety of government bonds. Demand increases, which pushes the price of the bond up to US$110 in the open market. The government is still only paying that same fixed US$5 a year. If a new investor buys the bond at US$110, the yield on that US$5 payment falls to about 4.5%.
The price went up, but the yield went down.
Conversely, if investors sell bonds to buy riskier assets, the price of the bond may drop to US$90. That same fixed US$5 payment now represents a higher yield of about 5.5%.
The price went down, but the yield went up.
Interactive Price vs. Yield Simulator
Drag the slider to see how market demand mathematically shifts the yield.
Fixed Payout$5.00
Market Price$100
Current Yield5.00%
Mass Sell-off ($80)Panic Buying ($120)
MARKET STATUS: PAR VALUE (Baseline)
Two key Treasury yields traders often watch
Traders do not need to follow the entire bond market. Two US government bond yields often receive the most attention because they send different signals.
The US 2-year Treasury yield reflects the market’s near-term expectations for central bank policy. Because it matures in two years, it is highly sensitive to what traders believe the Federal Reserve may do with interest rates at upcoming meetings.
The US 10-year Treasury yield reflects the market’s view of longer-term economic growth, inflation and risk appetite. It is the benchmark borrowing rate for the global economy. When commentators say “yields are rising”, they are often referring to the 10-year yield.
The difference between yields across maturities is known as the yield curve. A changing yield curve can suggest shifts in expectations for growth, inflation and monetary policy.
What moves bond yields
Bond yields do not move in a vacuum. They respond to macroeconomic data, central bank signals, investor positioning and risk sentiment.
Understanding which force is currently driving the move can help traders avoid reacting only to the headline and start reading the context behind it.
What moves bond yields
Inflation expectations
Higher yields driven by inflation can weigh on gold, growth stocks and rate-sensitive assets.
↓ tap to expand
When inflation rises, or is expected to rise, investors may demand higher returns to compensate for the loss of purchasing power.
Yields may rise
When inflation data surprises to the upside or when markets expect central banks to keep rates higher for longer.
Yields may fall
When inflation cools, rate expectations ease or investors believe the inflation threat is becoming less persistent.
Fed and central bank policy
Fed expectations are one of the most important drivers of the 2-year yield and can flow directly into currency pairs, gold and equity indices.
↓ tap to expand
Central bank expectations are especially important for shorter-dated yields. The US 2-year Treasury yield often moves sharply when markets reprice the likely path of Federal Reserve policy.
Yields may rise
When the Fed signals rate hikes, delayed cuts or a higher-for-longer policy stance.
Yields may fall
When the Fed signals a possible pivot, slower inflation or weaker growth.
Economic growth outlook
The 10-year yield is often watched as a signal of long-run growth, inflation and market confidence.
↓ tap to expand
The 10-year yield is heavily influenced by the market’s view of long-term growth.
Yields may rise
When growth is strong and investors move from bonds into risk assets, pushing bond prices lower.
Yields may fall
When growth slows, recession fears rise or investors seek the perceived safety of government bonds.
Risk sentiment and safe-haven demand
Yield moves during stress periods can reflect positioning, liquidity and safe-haven demand, not just fundamentals.
↓ tap to expand
During periods of stress, bond yields can move in ways that appear to contradict the economic data.
Yields may rise
In a risk-on environment, investors may sell bonds and move into equities or other risk assets. That can push bond prices lower.
Yields may fall
In a risk-off environment, investors may buy government bonds for perceived safety. That can push bond prices higher.
Watch this, not just that
Do not just watch whether yields are rising or falling. Watch why they are moving.
A yield rise driven by strong growth is different from a yield rise driven by sticky inflation. A yield fall caused by lower inflation is different from a yield fall caused by panic buying during a market shock.
The first may support risk appetite. The second may pressure valuations. The market impact can be very different in each case.
Three common bond yield scenarios to recognise
The scenarios below map a simple chain: macro catalyst, yield mechanism and potential asset impact.
Macro Catalyst
Inflation surprise
CPI or inflation data comes in hotter than expected.
Yield Mechanism
Yields rise
Markets price higher rates or longer restrictive policy
Asset Impact
Gold ↓Growth stocks ↓USD ↑
Macro Catalyst
Growth scare
Weak labour market data or rising recession concerns.
Yield Mechanism
Yields fall
Investors buy bonds for perceived safety
Asset Impact
Equities ↓Gold ↑Currencies ↕
Macro Catalyst
Fed repricing
Fed decision or data shifts future rate expectations.
Yield Mechanism
2-yr moves quickly
Highly sensitive to near-term policy
Asset Impact
USD pairs ↕Equities ↕AUD/USD ↕
Common trap
Assuming a move in yields means the same thing every time.
For traders, a rising yield is not automatically positive or negative. It depends on the reason. A yield rise caused by stronger growth can send a very different signal from a yield rise caused by stubborn inflation or concerns about government debt supply.
The mistake is treating yields as a simple directional signal. They are not. They are a context signal, and that context can affect almost every market traders watch.
How yields may affect markets you trade
Once traders understand what yields are and why they move, they can map the potential impact across their trading screens.
1. Gold (XAU/USD) Gold tends to move inversely with real yields, which are nominal yields adjusted for inflation. When real yields fall, gold may become more attractive because the opportunity cost of holding a zero-yield asset decreases. When real yields rise, gold can come under pressure because interest-bearing assets may become relatively more attractive.
2. Tech and growth stocks Higher yields increase the discount rate applied to future earnings. This can weigh on growth stocks because much of their expected value is tied to earnings that may arrive years from now. That is one reason the Nasdaq 100 is often described as rate-sensitive.
3. US dollar Higher US yields can attract foreign capital seeking better returns. That can increase demand for the US dollar, particularly when US yields are rising faster than yields in other major economies.
4. AUD/USD AUD/USD is sensitive to the interest rate differential between the Reserve Bank of Australia and the Federal Reserve. When US yields rise faster than Australian yields, the rate differential may favour the US dollar and weigh on AUD/USD.
Gold · XAU/USD
May weaken if real yields rise
↓
Tech & Growth
Valuation pressure increases
↓
US Dollar
May strengthen on yield gap
↑
AUD/USD
Rate differential favours USD
↓
Typical directional impacts when US yields rise. Tendencies, not guarantees.
When yields may deserve closer attention
Bond yields do not need to be monitored every minute. However, there are specific windows when yield moves may have a stronger influence on market pricing.
CPI releases: Inflation data can move yields because it changes expectations for the Fed, real yields and the future path of interest rates. It can be useful to watch what the data implies for rates, not just whether the headline number is higher or lower than expected.
Federal Reserve meetings: Fed decisions, press conferences and forward guidance can directly reprice the short end of the yield curve. The statement, dot plot and chair’s comments may all influence whether markets expect tighter or looser policy ahead.
Non-Farm Payrolls and jobs data: Strong employment data can reduce expectations for near-term rate cuts. Weak labour market data can increase expectations for Fed easing. Both outcomes can move US yields significantly.
Major risk-off events: Geopolitical shocks, banking stress or sharp equity sell-offs can trigger sudden demand for perceived safe-haven assets, including US government bonds. In these periods, yields may fall quickly as bond prices rise, even if the underlying inflation backdrop has not changed.
Test your knowledge
1 / 12
0 correct
0 wrong
Concept Check
How sure are you?
Your call
Questions Correct
Round Review
Key takeaway
Bond yields are not just something bond traders watch. They are one of the key inputs that can influence pricing across gold, currencies, equities and risk assets. When yields move, the key question is not only whether they moved up or down. It is why they moved, and which markets may be most sensitive to that change.
What are the five Asian tech and infrastructure stocks linked to the AI buildout?
Market Intelligence Insights | GO Markets
Jensen Huang stood on stage at GTC 2026 and projected US$1 trillion in cumulative AI hardware revenue through 2027, spanning the current Blackwell generation and the newly announced Vera Rubin architecture. That is not just a corporate forecast. It is a gravitational pull reshaping parts of the global technology sector.
In market circles, this effect is often linked to Huang's ability to move sentiment across AI-related stocks.
Here is the part that many retail investors can miss: NVIDIA is a fabless chip designer. It conceives the architecture and writes the code, but manufactures none of the actual silicon. Every dollar of that US$1 trillion projection would need to flow through a highly concentrated manufacturing pathway, and that route runs directly through Asia.
For APAC traders, the headline rally in New York is only half the story. The broader opportunity sits inside the Asian technology giants linked to the hardware supercycle: the companies making the parts, infrastructure and capacity without which none of this works.
The largest passive exchange traded funds (ETFs) in the world are moving through a highly concentrated market structure. According to Morningstar Direct and Trivariate Research data, approximately 31.3% of the S&P 500 is now concentrated in just seven stocks. When too many dollars chase too few names, diversification can become less reliable and valuation multiples are more exposed.
US tech giants
High concentration longs
Seven stocks. 31.3% of the S&P 500. When positioning is this crowded, even a beat can fail to move the stock. The multiple is already doing the work the earnings should do.
→ Valuation multiple risk
APAC enablers
Uncrowded physical plays
Memory in Seoul. Foundries in Hsinchu. Power grids in Tokyo. These stocks do not need multiple expansion to perform. They need NVIDIA to keep shipping.
→ Pure-play volume capture
The APAC enablers tell a different story. They are less crowded than the US mega-cap AI trade, central to the buildout and driven more by volume capture than multiple expansion.
Where each stock sits in the stack
Layer 01
Memory Subsystem: Samsung & SK Hynix
Supplies high-bandwidth memory (HBM4) optimized for modern accelerator architectures.
Layer 02
Physical Fabrication: TSMC Foundry
Manages pure-play silicon wafer etching and critical advanced CoWoS packaging.
Layer 03
Architecture Core: NVIDIA (Fabless)
Conceives system logic blueprints (Blackwell/Vera Rubin platform architecture).
Layer 04
Deployment & Utilities: Alibaba Cloud & Hitachi
Operates localized ASIC data centre clusters and updates grid power infrastructure.
The thesis is direct: identify the companies supplying the raw materials, components and infrastructure, regardless of which AI model ultimately wins the commercial software race.
Five stocks across the AI infrastructure chain
Value Chain Stack Architecture // Individual Operators
01TSMC2330.TW
Taiwan Core Foundry
Taiwan Semiconductor Manufacturing Company is the foundry that makes the most advanced processors used across NVIDIA's AI accelerator roadmap. There is no credible alternative at scale for the cutting-edge chips the industry currently requires. That gives TSMC significant strategic relevance in this cycle.
For Q1 2026, the company posted revenue of US$35.9 billion, up more than 40% year-on-year, with a gross margin of 66.2%. High-performance computing (HPC), including AI-related revenue, accounted for about 61% of Q1 revenue.
Q1 2026 RevUS$35.9B
Gross Margin66.2%
HPC Segment61%
Watchpoint: CoWoS packaging capacity is still the constraint to watch. Recent supply-chain estimates from TrendForce and Silicon Analysts indicate that TSMC's CoWoS lines are fully booked, with lead times stretching as far as 104 weeks and capacity meeting only around 80% of aggregate demand. The question is whether TSMC's committed US$52 billion to US$56 billion capital expenditure (capex) for 2026 helps close the gap before demand moves further ahead of capacity.
02Samsung Electronics005930.KS
South Korea Memory
Samsung sits one layer above the processing core in the AI chip stack, supplying the high-bandwidth memory (HBM) that helps advanced processors operate at the speeds artificial intelligence workloads demand.
Samsung says its sixth-generation HBM4 is now in mass production and designed for the Vera Rubin platform. That places Samsung inside the next phase of AI infrastructure demand, alongside other HBM suppliers competing for allocation across advanced systems.
Watchpoint: Global tariff headwinds and domestic labour negotiations are the main operational risks to monitor, alongside profitability metrics in Samsung's semiconductor division.
03SK Hynix000660.KS
South Korea Memory
SK Hynix pioneered earlier generations of HBM architecture and remains deeply integrated into the NVIDIA value chain. That relationship is visible in upstream data: FormFactor reported SK Hynix accounted for 29.5% of its Q1 2026 revenue, with NVIDIA accounting for another 10.2%.
SK Hynix is also reportedly evaluating whether its memory products can work with Intel's packaging technology. That move reads as a potential hedge against TSMC's constrained CoWoS capacity.
Watchpoint: Geographic concentration is a real pressure point. Any escalation in regional geopolitical tensions would feed directly into this heavily centralised component ecosystem.
04Alibaba GroupBABA / 9988.HK
China Cloud Infrastructure
While the semiconductor companies capture the manufacturing layer, Alibaba represents the enterprise adoption layer. China's 15th Five-Year Plan for 2026 to 2030 places significant emphasis on an "AI plus" initiative and technology self-reliance.
Alibaba gives investors exposure to China's domestic AI infrastructure push, including customised computing clusters using locally designed application-specific integrated circuits (ASICs) as an alternative to Western-restricted hardware.
Watchpoint: The pressure is margin support. Markets are watching whether consumer-facing revenue can recover strongly enough to support the cloud division while capital-intensive infrastructure spending remains elevated.
05Hitachi6501.T
Japan Grid Infrastructure
Hitachi is not a chip company. It is an industrial conglomerate with deep expertise in factory automation and power grid infrastructure. AI data centres consume enormous amounts of electricity, which can place serious pressure on power networks.
Hitachi recently announced a major collaboration with Intel covering factory automation, energy infrastructure and custom chip design. Hitachi links the digital AI story with the infrastructure layer in Japan, where grid investment, automation and industrial efficiency are becoming part of the same conversation.
Watchpoint: Japanese manufacturers still face margin pressure from elevated domestic energy costs. Material cost inflation also remains a drag on industrial margins.
Macro Matrix Catalyst
16 June 2026
The APAC Central Bank Double-Header
This is the main macro date APAC tech traders need to watch.
Reserve Bank of Australia
4.35% Base
Hold Expected
A hawkish hold is expected as policymakers weigh energy-driven inflation. The RBA's posture is likely to remain important for the yield floor in Australian dollar carry trades.
Bank of Japan
1.00% Projected
66% Hike Prob.
Markets are pricing a 66% probability of a move to 1.00% as policymakers weigh yen weakness and the risk of a disorderly breach of the 160.00 level.
Bottom Line
Do not just watch the green candles in New York. The broader AI infrastructure story runs through memory in Seoul, foundries in Hsinchu and power grids in Tokyo. For traders, the task is to understand which parts of the hardware stack are most exposed before the next macro catalyst arrives. On 16 June, central bank decisions in Australia and Japan could shift the backdrop for APAC technology names.
Intel’s reported Google TPU order has injected fresh drama into the AI chip race.
Intel, TSMC and the AI Chip Squeeze | GO Markets Insights
For most of the artificial intelligence (AI) boom, the market has treated Taiwan Semiconductor Manufacturing Company (TSMC) as the toll road everyone had to use. Nvidia, Apple, AMD, Broadcom and many major AI chip players relied on its manufacturing capacity.
Now that story is getting more complicated.
Intel reportedly jumped more than 11% on Monday, 8 June 2026, after reports that Google had placed an order for more than 3 million custom tensor processing units (TPUs) with Intel Foundry for delivery from 2028.
That does not make Intel the new TSMC. It does suggest the market is asking a sharper question: what happens when the AI boom starts running into capacity limits?
Demand for leading-edge wafers and advanced packaging has grown faster than the supply chain can comfortably absorb. That pressure is now forcing major AI customers to consider alternatives, not necessarily because they are abandoning TSMC, but because they may need more than one route to production.
One answer that emerged on Monday was Intel.
Google has reportedly placed an order with Intel to manufacture more than three million in-house tensor processing units in 2028. Nvidia is also reportedly evaluating Intel’s advanced packaging and 18A process for future chips, according to The Information, which cited people with direct knowledge of the talks.
Why Intel moved
Intel shares rose roughly 11% on Monday, closing at US$110.27. The move added to a sharp 2026 rally and signalled that investors may be reassessing Intel’s role in the AI supply chain.
“The AI boom appears to be testing the physical limits of capacity in Taiwan. Intel may be one of the few US companies with infrastructure that could absorb part of the overflow.”
To understand why Monday's news mattered so much, it helps to understand one often-overlooked part of chipmaking: advanced packaging.
Building an AI chip is not just about making the chip itself. Manufacturers also need to connect the processor, memory and other components together so they can work as a single system. That final assembly step is known as advanced packaging.
TSMC dominates one of the most important packaging technologies, called CoWoS (Chip on Wafer on Substrate). The challenge is that demand for CoWoS has surged alongside the AI boom.
Nvidia alone is expected to account for about 60% of global CoWoS demand in 2026, while Broadcom and AMD are expected to take another 26%. That leaves relatively little capacity available for smaller AI chip developers and custom chip makers.
CoWoS
2026 Demand
Projected Advanced Packaging Demand
Nvidia60%
Broadcom & AMD26%
Other Developers / ASICs14%
Projected CoWoS demand concentration in 2026. Nvidia, Broadcom and AMD are expected to absorb most available advanced packaging capacity, leaving a smaller share for other developers and ASIC vendors. Figures are illustrative and based on reported industry estimates.
In simple terms, demand for AI chips is growing so quickly that one of the industry's key manufacturing steps is becoming a bottleneck.
Where Intel may fit
Intel has been developing its own alternative packaging technology, called EMIB, or Embedded Multi-die Interconnect Bridge. The technical details are complex, but the market point is simple: Intel believes EMIB can support large AI chip designs and may become an alternative to TSMC’s CoWoS for some workloads.
Intel’s EMIB has reportedly gained traction at Google and Meta, with production yields said to reach around 90%. Yield refers to the percentage of chips that come off the production line working properly. Higher yields generally mean lower costs and more reliable manufacturing.
The geopolitical angle also matters. Some chips made at TSMC’s Arizona facility may still need advanced packaging in Taiwan before final delivery. That weakens the idea of a fully onshore supply chain and helps explain why US-based packaging capacity is getting more attention.
1
Fabrication
Dies etched at TSMC facility in Arizona, USA.
→
2
Transit
Partly completed chips shipped over the Pacific.
→
3
Assembly
Advanced packaging applied back in Taiwan.
→
4
Distribution
Finished hardware distributed to end markets.
This packaging dependency complicates the local assembly objective behind the US onshore framework.
The extended fabrication and packaging loop. Chips fabricated in Arizona may still require advanced packaging in Taiwan before final distribution, highlighting a potential supply chain vulnerability.
The Intel story is not just about one company winning a contract. It is a signal about where the AI supply chain may be heading.
When Google, one of TSMC’s key customers, reportedly tests a competitor’s packaging technology and then places a multi-million-unit order, the market hears several things at once: TSMC’s capacity constraints may be pushing customers toward alternatives, Intel’s technology may be gaining credibility, and the old “Intel is too far behind to matter” narrative may need updating.
Intel has gained approximately 422% over the past 12 months, an unusually large move for a large-cap semiconductor stock. For traders, the transmission effect is broader than Intel alone. A stronger Intel foundry story may attract capital into US semiconductor names and create a relative value debate between Intel and TSMC, not because TSMC is in trouble, but because its near-monopoly premium is being reassessed.
INTC vs TSM, relative performance in 2026
Year to date (YTD) performance to 9 June 2026. Figures are approximate and provided for illustrative market context.
~+175%
INTC
Intel Corp
~-30%
TSM
TSMC
~-60%
NVDA
NVIDIA
~-25%
SOX
PHLX Semi
Assets and names to watch
A structural shift in foundry dynamics ripples outward across key technology components. Monitor this streamlined breakdown to scan positioning profiles.
Name
Why it matters
What to watch
Intel Corporation
US foundry challenger. The reported Google TPU order and Nvidia trials support the second-source story, but foundry losses and execution risk remain the key limits.
Google order final confirmation, 18A process yields, structural foundry unit losses.
TSMC
Still the dominant global foundry. The risk is not immediate share loss, but that capacity limits create space for alternatives to gain relevance.
The demand engine behind much of the AI supply chain pressure. Its Intel trials matter, but testing does not equal a production shift.
Whether multi-project wafer trials translate into high-volume commercial production orders.
SMH ETF
Broad semiconductor exposure through a basket containing TSMC, NVIDIA and Intel.
Useful for tracking whether the story is stock-specific or sector-wide.
Bull case, cautionary case and what could go wrong
The supportive case for Intel is easy to understand. AI demand remains strong, TSMC capacity stays tight and major customers are looking for credible second-source manufacturing options. If Intel can turn reported trials and early customer interest into commercial production, the market may continue to treat its foundry strategy as more credible.
But this is still a conditional story, not a completed turnaround.
Intel’s foundry unit posted an operating loss of approximately US$10.3 billion in fiscal 2025, while the stock has already rallied about 175% year to date (YTD). That leaves less room for disappointment if future updates fall short.
The biggest technical test is 18A. Intel needs its manufacturing process to reach yields that commercial customers can rely on. Yield refers to the share of chips that come out usable. If Q2 disclosures disappoint, confidence in the foundry story could weaken.
Customer confirmation also matters. NVIDIA has not placed a production order with Intel. Reported Feynman architecture trials are still early stage, and testing does not guarantee committed production volume.
TSMC is another constraint on the Intel bull case. It is targeting CoWoS capacity of approximately 130,000 to 140,000 wafers per month by 2026 to 2027. If that expansion catches up with demand, the pressure pushing customers toward alternatives may ease.
There is also the broader AI spending cycle. If hyperscalers such as Google, Microsoft, Amazon and Meta slow infrastructure spending, the whole semiconductor sector could come under pressure, regardless of Intel’s progress.
The key variables to watch are customer confirmation, 18A yield progress, Intel foundry pipeline updates, TSMC capacity expansion and whether AI infrastructure spending remains strong.
Key takeaway
The semiconductor space is no longer just about raw processor speeds, it has become an execution battleground for advanced packaging capacity and global footprint resilience.
GO Markets Professional
Don't trade the surprise — trade the setup
Know when banks report, and set your levels ahead of CPI/jobs.