ข่าวสารตลาด & มุมมองเชิงลึก
ก้าวนำตลาดด้วยมุมมองเชิงลึกจากผู้เชี่ยวชาญ ข่าวสาร และการวิเคราะห์ทางเทคนิค เพื่อเป็นแนวทางในการตัดสินใจซื้อขายของคุณ.
.jpeg)
Forex
Central Banks
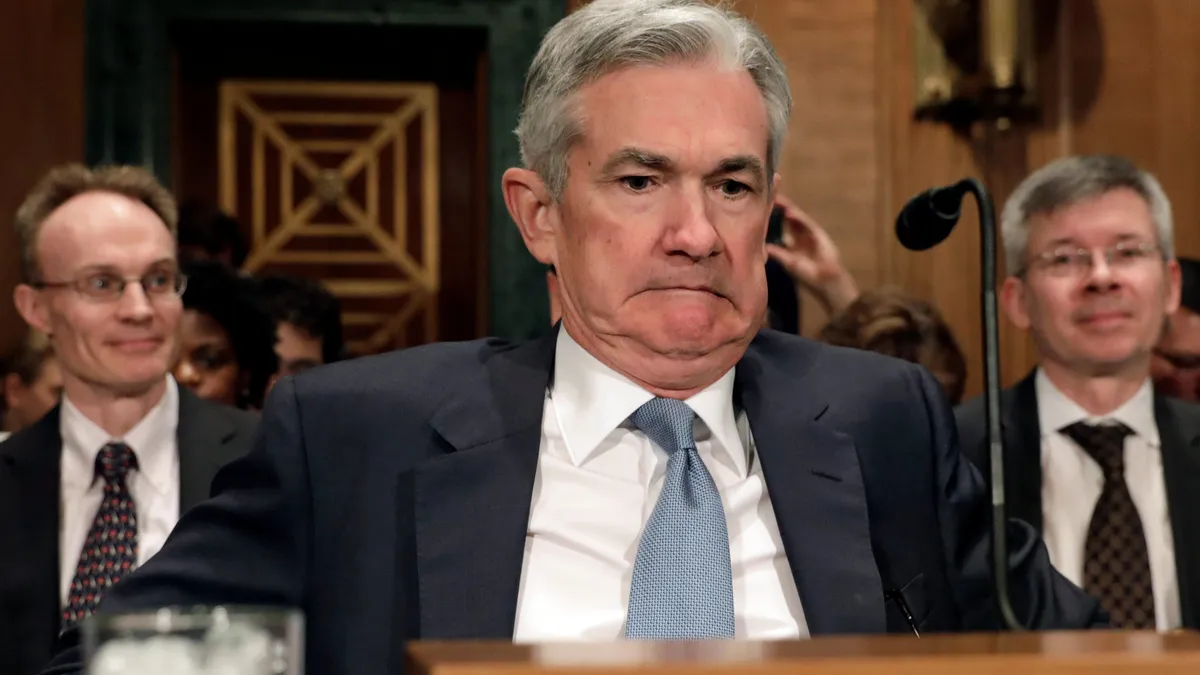
ตลาดสกุลเงินในเดือนมิถุนายนได้รับอิทธิพลจากการกลับมาชันขึ้นของเส้นอัตราผลตอบแทนพันธบัตรรัฐบาลสหรัฐฯ ความต้องการสินทรัพย์ปลอดภัย และทิศทางนโยบายการเงินที่แตกต่างกัน
GO Markets
•
May 26, 2026


Central Banks

Shares and Indices

Shares and Indices