The information provided is of general nature only and does not take into account your personal objectives, financial situations or needs. Before acting on any information provided, you should consider whether the information is suitable for you and your personal circumstances and if necessary, seek appropriate professional advice. All opinions, conclusions, forecasts or recommendations are reasonably held at the time of compilation but are subject to change without notice. Past performance is not an indication of future performance. Go Markets Pty Ltd, ABN 85 081 864 039, AFSL 254963 is a CFD issuer, and trading carries significant risks and is not suitable for everyone. You do not own or have any interest in the rights to the underlying assets. You should consider the appropriateness by reviewing our TMD, FSG, PDS and other CFD legal documents to ensure you understand the risks before you invest in CFDs. These documents are available here.
Any references to Australian or international shares, sectors, indices, ETFs, crypto-related stocks or other instruments are provided for market commentary and watchlist purposes only and do not constitute a recommendation, offer or solicitation to buy, sell or hold any financial product or adopt any investment strategy. International markets may involve additional risks, including currency fluctuations, regulatory differences, market structure differences, reduced liquidity and higher volatility. Company-specific, sector-specific and macroeconomic risks may also affect performance.
Commentary on geopolitical developments, economic data, central bank decisions, earnings, policy changes and other global or financial market events is based on information available at the time of publication and may change without notice. Such events can lead to sudden market moves, price gaps, reduced liquidity, wider spreads and increased volatility, particularly in leveraged products such as CFDs. Forward-looking statements, expectations and scenario analysis are inherently uncertain and should not be relied on as guarantees of future market behaviour or outcomes.
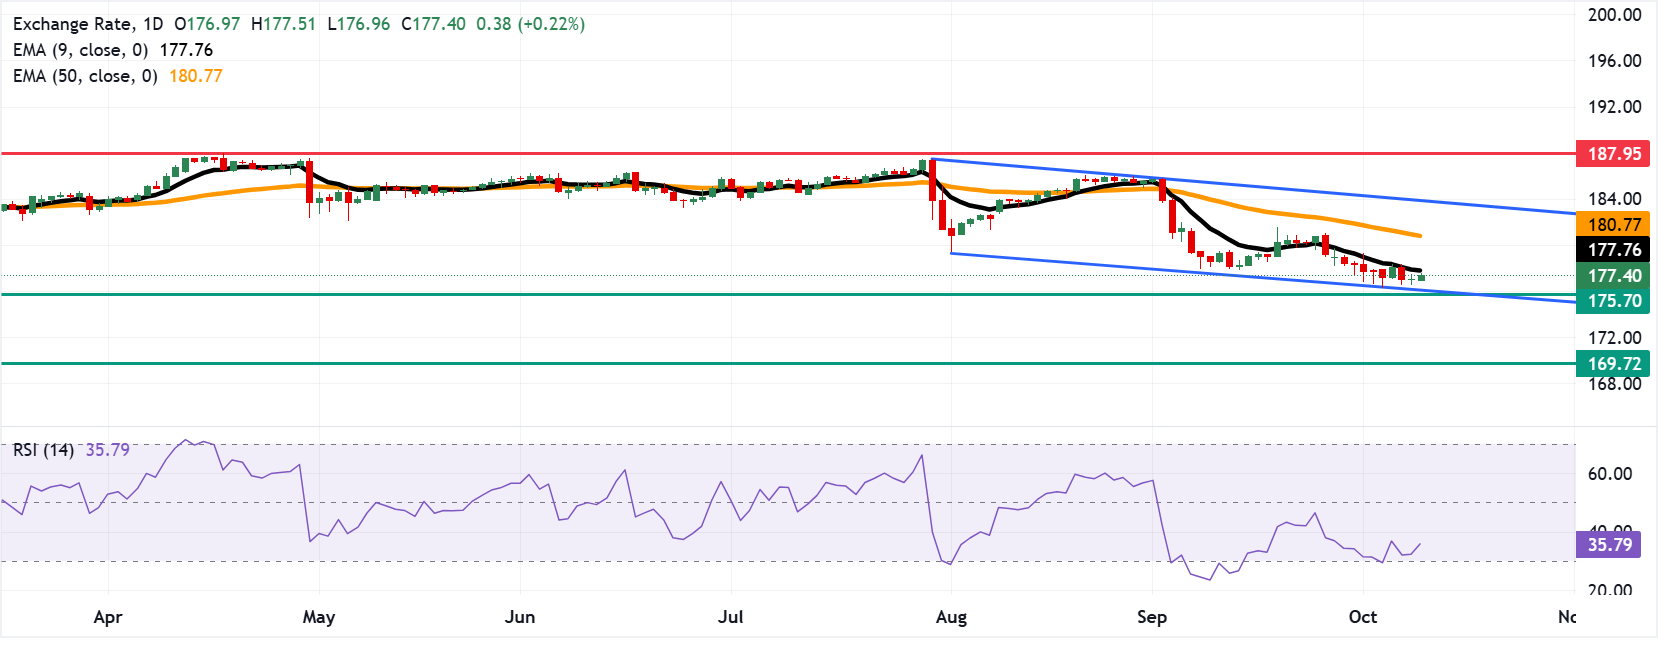
EUR/JPY Price Forecast: Tests 177.50 barrier near nine-day EMA

- EUR/JPY may fall toward the lower boundary of the descending channel around 176.20.
- The 14-day Relative Strength Index is at 35.8, signalling persistent yet moderating downside momentum.
- The primary barrier lies at the nine-day EMA at 177.76.
EUR/JPY gains ground for the second consecutive day, trading around 177.40 during Asian hours on Friday. Technical analysis of the daily chart shows that the currency cross is moving downward within the descending channel pattern, suggesting a persistent bearish bias.
The EUR/JPY cross is retaining a bearish near-term bias as it holds below both the nine- and 50-period Exponential Moving Averages (EMAs). The short-term EMA is positioned beneath the longer one, and price remains under both, suggesting that recent rebounds are capped by overhead supply, while the 14-day Relative Strength Index (RSI) around 35.8 stays just above oversold territory, hinting at persistent but moderating downside pressure rather than an imminent bullish reversal.
The EUR/JPY cross may find initial support at the lower boundary of the descending channel around 176.20, followed by an 11-month low of 175.70, recorded in November 2025. Further declines below this confluence support zone would expose the 14-month low of 169.72.
On the upside, the EUR/JPY cross could test the primary resistance at the nine-day EMA of 177.76, followed by the 50-day EMA at 180.77. A break above these moving averages would support the EUR/JPY cross to approach the upper boundary of the descending channel around 184.00, followed by the all-time high of 187.95 set on April 17.
Moulin flags energy-driven inflation but downplays second-round risks
ECB's Moulin delivers a mid-range impact at 6.2/10, exactly in line with the historic average on FXS Speechtracker, signaling no major shift in perceived policy stance. The focus on inflation being "100% energy" and the absence of second-round effects leans mildly dovish, suggesting limited urgency for aggressive tightening despite acknowledging an inflationary shock.
However, the warning that the geopolitical shock is transmitting into a financial shock introduces a cautious tone that tempers any dovish read. Moulin’s emphasis on resilient Euro area growth supports the view that the ECB can afford to be patient, reinforcing a balanced bias that is unlikely to materially reprice Euro expectations in the near term.
(The technical analysis of this story was written with the help of an AI tool. Know more.)
Euro Price Today
The table below shows the percentage change of Euro (EUR) against listed major currencies today. Euro was the strongest against the Japanese Yen.
| USD | EUR | GBP | JPY | CAD | AUD | NZD | CHF | |
|---|---|---|---|---|---|---|---|---|
| USD | -0.14% | -0.09% | 0.09% | -0.09% | -0.27% | -0.30% | -0.22% | |
| EUR | 0.14% | 0.06% | 0.23% | 0.06% | -0.12% | -0.13% | -0.09% | |
| GBP | 0.09% | -0.06% | 0.21% | 0.04% | -0.15% | -0.19% | -0.09% | |
| JPY | -0.09% | -0.23% | -0.21% | -0.18% | -0.37% | -0.38% | -0.29% | |
| CAD | 0.09% | -0.06% | -0.04% | 0.18% | -0.21% | -0.21% | -0.11% | |
| AUD | 0.27% | 0.12% | 0.15% | 0.37% | 0.21% | -0.01% | 0.10% | |
| NZD | 0.30% | 0.13% | 0.19% | 0.38% | 0.21% | 0.01% | 0.10% | |
| CHF | 0.22% | 0.09% | 0.09% | 0.29% | 0.11% | -0.10% | -0.10% |
The heat map shows percentage changes of major currencies against each other. The base currency is picked from the left column, while the quote currency is picked from the top row. For example, if you pick the Euro from the left column and move along the horizontal line to the US Dollar, the percentage change displayed in the box will represent EUR (base)/USD (quote).
Related Articles