
ตั้งแต่ผู้ขัดขวางเทคโนโลยีไปจนถึงผู้รับเหมาด้านการป้องกัน บริษัท ที่พูดถึงมากที่สุดของตลาดบางแห่งเริ่มการเดินทางสาธารณะผ่านการเสนอขายสาธารณะครั้งแรก (IPO)สำหรับเทรดเดอร์ รายการสาธารณะเบื้องต้นเหล่านี้สามารถแสดงถึงสภาพแวดล้อมการซื้อขายที่ไม่เหมือนใคร แต่ยังเป็นช่วงเวลาแห่งความไม่แน่นอนที่เพิ่มขึ้นด้วย
ข้อเท็จจริงด่วน
- IPO คือเมื่อ บริษัท เอกชนจดทะเบียนหุ้นในตลาดหลักทรัพย์สาธารณะเป็นครั้งแรก
- IPO สามารถเสนอให้เทรดเดอร์เข้าถึงบริษัทที่เติบโตสูงได้ตั้งแต่เนิ่นๆ แต่มาพร้อมกับความผันผวนที่สูงขึ้นและประวัติราคาที่ จำกัด
- เมื่อจดทะเบียนแล้ว เทรดเดอร์สามารถได้รับโอกาสในการเปิดเผยหุ้น IPO ผ่านการซื้อหุ้นโดยตรงหรืออนุพันธ์ เช่น สัญญาสำหรับความแตกต่าง (CFD).
การเสนอขายสาธารณะครั้งแรก (IPO) คืออะไร?
IPO คือเมื่อ บริษัท เสนอหุ้นให้กับประชาชนเป็นครั้งแรก
ก่อนที่จะดำเนินการ IPO หุ้นใน บริษัท มักจะถือโดยผู้ก่อตั้ง พนักงานแรกๆ และนักลงทุนเอกชนเท่านั้นการเปิดเผยต่อสาธารณะทำให้ทุกคนสามารถซื้อหุ้นได้
ขึ้นอยู่กับขนาดของ บริษัท โดยปกติจะแสดงรายการหุ้นสาธารณะในตลาดหลักทรัพย์ท้องถิ่น (ตัวอย่างเช่น แอ็กซ์ ในออสเตรเลีย)อย่างไรก็ตาม บริษัท ประเมินมูลค่าขนาดใหญ่บางแห่งเลือกที่จะลงทะเบียนในตลาดหลักทรัพย์ทั่วโลกเท่านั้น เช่น Nasdaq ไม่ว่าสำนักงานใหญ่ของพวกเขาจะอยู่ที่ไหน
สำหรับนักเทรดโดยทั่วไปแล้ว IPO เป็นโอกาสแรกที่จะได้รับความเสี่ยงต่อหุ้นของ บริษัทพวกเขาสามารถสร้างสภาพแวดล้อมที่เป็นเอกลักษณ์พร้อมความผันผวนและสภาพคล่องที่เพิ่มขึ้น แต่ยังมีความเสี่ยงที่สูงขึ้นด้วยประวัติราคาที่ จำกัด และความอ่อนไหวต่อการเปลี่ยนแปลงของความเชื่อมั่น
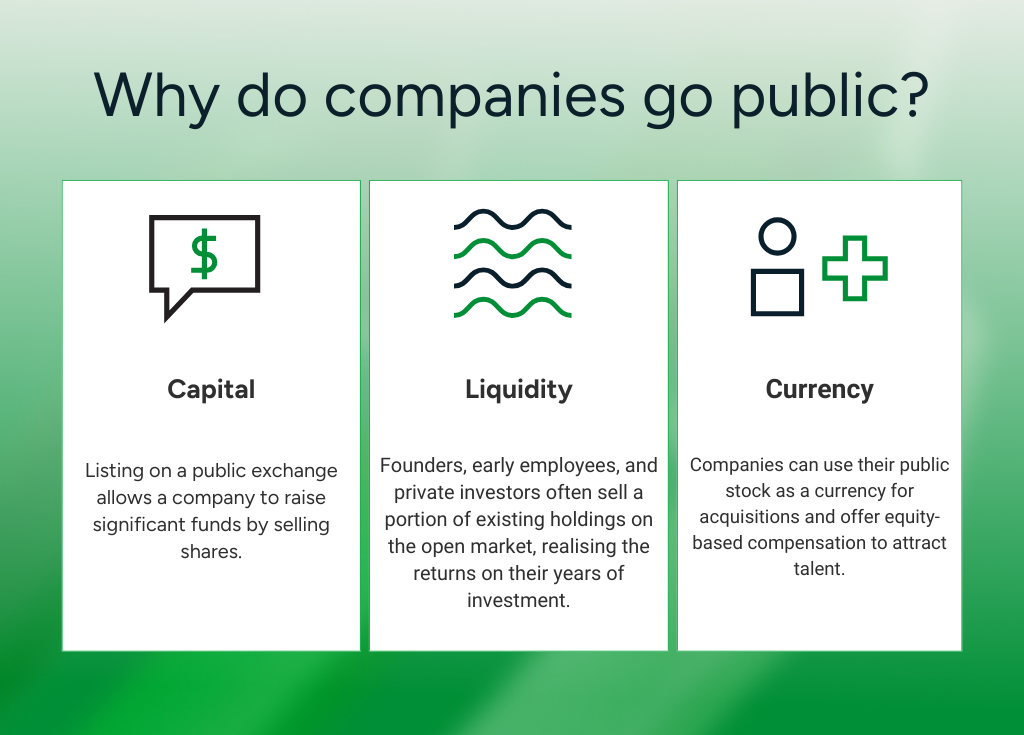
ทำไม บริษัท จึงเปิดเผยต่อสาธารณะ
ตัวขับเคลื่อนที่ใหญ่ที่สุดในการดำเนินการ IPO คือการเข้าถึงเงินทุนมากขึ้นการจดทะเบียนในตลาดหลักทรัพย์หมายความว่า บริษัท สามารถระดมทุนได้อย่างมีนัยสำคัญโดยการขายหุ้น
นอกจากนี้ยังให้สภาพคล่องสำหรับผู้ถือหุ้นที่มีอยู่ผู้ก่อตั้ง พนักงานยุคแรก และนักลงทุนเอกชนมักขายส่วนหนึ่งของการถือครองที่มีอยู่ในตลาดเปิด โดยตระหนักถึงผลตอบแทนจากการสนับสนุนหลายปีของพวกเขา
นอกเหนือจากผลประโยชน์ทางการเงินแล้ว การเข้าสู่สาธารณะหมายความว่า บริษัท ต่างๆสามารถใช้หุ้นของตนเป็นสกุลเงินสำหรับการซื้อกิจการและเสนอค่าชดเชยตามหลักทรัพย์เพื่อดึงดูดผู้มีความสามารถได้และการประเมินมูลค่าสาธารณะให้เกณฑ์มาตรฐานที่โปร่งใส ซึ่งมีประโยชน์สำหรับการวางตำแหน่งเชิงกลยุทธ์และการระดมทุนในอนาคต
อย่างไรก็ตามมันมาพร้อมกับข้อเท็จจริงบริษัทมหาชนต้องปฏิบัติตามภาระผูกพันในการเปิดเผยข้อมูลและการรายงานอย่างต่อเนื่อง และความกดดันจากผู้ถือหุ้นสาธารณะอาจกลายเป็นอุปสรรคต่อความคืบหน้าในระยะยาวหากหลายคนมุ่งเน้นไปที่ผลการดำเนินงานระยะสั้น
กระบวนการ IPO ทำงานอย่างไร?
แม้ว่าข้อมูลเฉพาะจะแตกต่างกันไปตามเขตอำนาจศาล แต่การเปลี่ยนจาก บริษัท เอกชนไปเป็นรายชื่อสาธารณะโดยทั่วไปเกี่ยวข้องกับขั้นตอนต่อไปนี้:
1.การเตรียมการ
บริษัทคัดเลือกผู้รับผิดชอบก่อน (โดยทั่วไปจะเป็นธนาคารเพื่อลงทุน) เพื่อจัดการการเสนอขายพวกเขาร่วมกันประเมินทางการเงินโครงสร้างองค์กรและตำแหน่งตลาดของ บริษัท เพื่อกำหนดแนวทางที่ดีที่สุดสำหรับการเปิดเผยต่อสาธารณะเป็นขั้นตอนการวางแผนที่หนักเพื่อให้แน่ใจว่า บริษัท พร้อมที่จะเปิดเผยต่อสาธารณะจริงๆ
2.การลงทะเบียน
เมื่อเตรียมทุกอย่างแล้ว ผู้รับประกันจะทำการตรวจสอบการตรวจสอบสถานะอย่างละเอียดและยื่นเอกสารการเปิดเผยที่จำเป็นกับหน่วยงานกำกับดูแลที่เกี่ยวข้องเอกสารเหล่านี้ให้การเปิดเผยรายละเอียดแก่หน่วยงานกำกับดูแลเกี่ยวกับ บริษัท การบริหารและการเสนอขายที่เสนอในออสเตรเลีย โดยทั่วไปแล้วจะเป็นหนังสือชี้ชวนที่ยื่นกับ ASIC ในสหรัฐอเมริกา คำชี้แจงการลงทะเบียนที่ยื่นต่อ SEC
3.การเดินทางไปจัดแสดงตามสถานที่ต่าง ๆ
ผู้บริหารของ บริษัท และผู้ประกันภัยจะนำเสนอกรณีการลงทุนต่อนักลงทุนสถาบันและนักวิเคราะห์ตลาดใน “โรดโชว์”ตู้โชว์นี้ได้รับการออกแบบมาเพื่อวัดความต้องการหุ้นและช่วยสร้างความสนใจนักลงทุนสถาบันสามารถลงทะเบียนผลประโยชน์และการประเมินมูลค่าของ IPO ซึ่งช่วยแจ้งการกำหนดราคาเริ่มต้น
4.การกำหนดราคา
จากข้อเสนอแนะจากงานแสดงสินค้าและเงื่อนไขตลาดปัจจุบัน ผู้ประกันภัยจะกำหนดราคาหุ้นสุดท้ายและกำหนดจำนวนหุ้นที่จะออกมาหุ้นจะถูกจัดสรรใน 'ตลาดหลัก' ให้กับนักลงทุนที่เข้าร่วมในข้อเสนอ (ก่อนที่หุ้นจะถูกจดทะเบียนต่อสาธารณะในตลาดรอง)กระบวนการนี้กำหนดราคาก่อนการตลาดซึ่งกำหนดการประเมินมูลค่าสาธารณะเบื้องต้นของ บริษัท อย่างมีประสิทธิภาพ
5.รายการ
ในวันจดทะเบียนหุ้นของ บริษัท เริ่มซื้อขายในตลาดหลักทรัพย์ที่เลือกเปิดตลาดรองอย่างเป็นทางการสำหรับผู้ค้าส่วนใหญ่นี่เป็นจุดแรกที่พวกเขาสามารถซื้อขายหุ้นได้ทั้งโดยตรงหรือผ่านอนุพันธ์เช่น หุ้น CFD.
6.หลังการเสนอขายหุ้น
เมื่อจดทะเบียนแล้ว บริษัทจะอยู่ภายใต้ข้อกำหนดในการรายงานและการเปิดเผยข้อมูลที่เข้มงวดต้องสื่อสารกับผู้ถือหุ้นเป็นประจำเผยแพร่ผลการเงินและปฏิบัติตามมาตรฐานการกำกับดูแลของตลาดหลักทรัพย์ที่จดทะเบียน
ความเสี่ยงและผลประโยชน์ของ IPO สำหรับผู้ค้า
เทรดเดอร์มีส่วนร่วมใน IPO อย่างไร?
สำหรับผู้ค้าส่วนใหญ่ การเข้าร่วมใน IPO เกิดขึ้นเมื่อหุ้นจดทะเบียนและเริ่มซื้อขายในตลาดรอง
เมื่อหุ้นอยู่ในตลาดหลักทรัพย์ นักลงทุนสามารถซื้อหุ้นทางกายภาพได้โดยตรงผ่านโบรกเกอร์หรือการแลกเปลี่ยนออนไลน์ หรือพวกเขาสามารถใช้อนุพันธ์เช่น หุ้น CFD เพื่อรับตำแหน่งในราคาโดยไม่ต้องเป็นเจ้าของสินทรัพย์อ้างอิง
สองสามวันแรกของการซื้อขาย IPO มักจะมีความผันผวนสูงผู้ค้าควรตรวจสอบให้แน่ใจว่าพวกเขาได้ใช้มาตรการบริหารความเสี่ยงที่เหมาะสมเพื่อช่วยป้องกันการเปลี่ยนแปลงของราคาที่อาจเกิดขึ้นอย่างรวดเร็ว
บรรทัดล่าง
IPO ทำเครื่องหมายเมื่อบริษัทสามารถลงทุนต่อสาธารณชนพวกเขาสามารถเสนอการเข้าถึงบริษัทที่มีการเติบโตสูงตั้งแต่เนิ่นๆ และสร้างสภาพแวดล้อมการซื้อขายที่ไม่เหมือนใครซึ่งขับเคลื่อนโดยความผันผวนที่สูงขึ้นและความสนใจของตลาด
สำหรับเทรดเดอร์ การทำความเข้าใจว่ากระบวนการทำงานอย่างไร ผลักดันการกำหนดราคาและผลการดำเนินงานหลังการเสนอขายหุ้นหลังการซื้อขาย และวิธีชั่งน้ำหนักของรางวัลที่อาจเกิดขึ้นกับความเสี่ยงของการซื้อขายหุ้นจดทะเบียนใหม่เป็นสิ่งสำคัญก่อนที่จะทำตำแหน่ง

Reportingdates and release times are based on company investor relations calendars whereconfirmed. Where dates or times are not marked confirmed, they are GO Marketsestimates. Consensus EPS, revenue and analyst-range data are sourced fromBloomberg and Earnings Whispers, as at 09 July 2026 (AEST). Company guidance,backlog and operating metrics are sourced from the latest company filings orresults presentations, unless stated otherwise. Any scenario analysis reflectsGO Markets analysis. Figures and schedules may change without notice.
The information provided is of general nature only and does not take into account your personal objectives, financial situations or needs. Before acting on any information provided, you should consider whether the information is suitable for you and your personal circumstances and if necessary, seek appropriate professional advice. All opinions, conclusions, forecasts or recommendations are reasonably held at the time of compilation but are subject to change without notice. Past performance is not an indication of future performance. Go Markets Pty Ltd, ABN 85 081 864 039, AFSL 254963 is a CFD issuer, and trading carries significant risks and is not suitable for everyone. You do not own or have any interest in the rights to the underlying assets. You should consider the appropriateness by reviewing our TMD, FSG, PDS and other CFD legal documents to ensure you understand the risks before you invest in CFDs.


.jpeg)


