

เหตุการณ์ใหญ่ระดับโลกเช่น การแข่งขันกีฬาโอลิมปิก สามารถดึงความสนใจออกจากตลาด เปลี่ยนการมีส่วนร่วม และลดปริมาณในกระเป๋าได้
เมื่อเกิดเหตุการณ์เช่นนั้น สภาพคล่องอาจดูอ่อนลง สเปรดอาจมีความสม่ำเสมอน้อยลง และการเคลื่อนไหวของราคาระยะสั้นอาจมีเสียงดังขึ้น แม้ว่าความผันผวนในระดับดัชนีที่กว้างขึ้นจะไม่เปลี่ยนแปลงอย่างมีนัยสำคัญ
ดังนั้นแทนที่จะถาม “โอลิมปิกสร้างความผันผวนหรือไม่?”เลนส์ที่ใช้งานได้จริงมากกว่าคือการถามว่า “เหตุการณ์ความผันผวนอะไรบ้าง ได้ ปรากฏตัวระหว่างเกมส์?”
ข้อเท็จจริงด่วน
- โดยทั่วไปหลักฐานจะอ่อนแอว่าโอลิมปิกเองเป็นตัวขับเคลื่อนความผันผวนของตลาดที่สม่ำเสมอและสอดคล้องกัน
- ความผันผวนสูงที่เกิดขึ้นระหว่างหน้าต่างโอลิมปิกมักจะตรงกับที่ใหญ่กว่า กองกำลังเคลื่อนไหวอยู่แล้วซึ่งรวมถึงความเครียดทางมหภาค ความประหลาดใจด้านนโยบาย และการเมืองทางภูมิศาสตร์
- ผลกระทบที่เชื่อมโยงกับโอลิมปิกที่ทำซ้ำได้มากขึ้นมีแนวโน้มที่จะเกิดขึ้นกับเงื่อนไขการดำเนินการ ไม่ใช่ระบอบการตลาดพื้นฐานใหม่
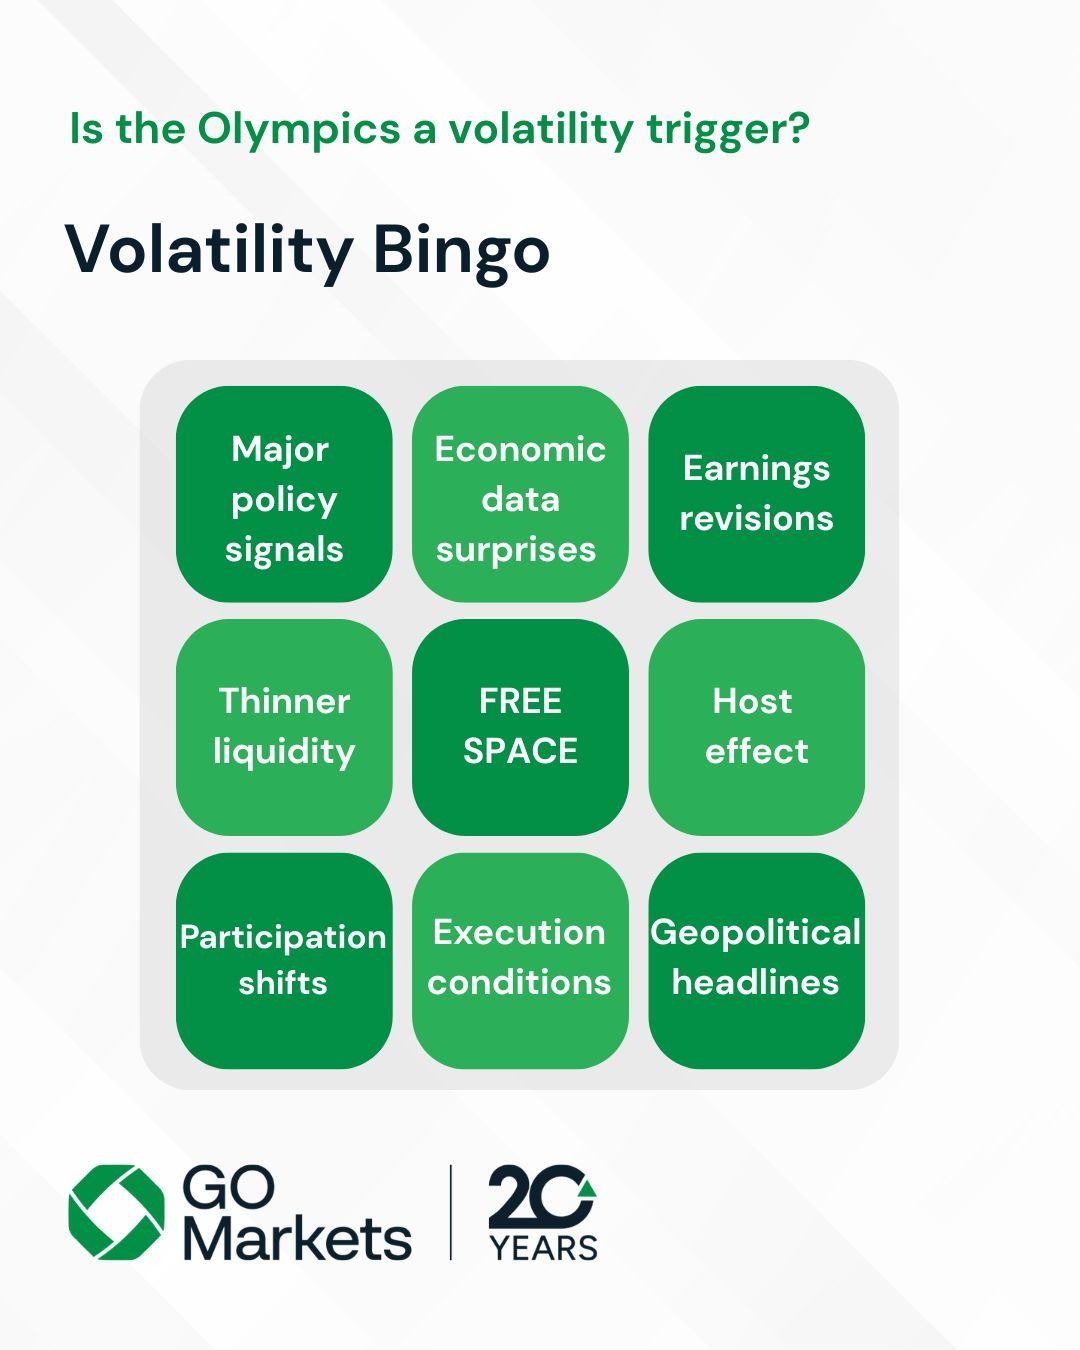
“บิงโกความผันผวนของโอลิมปิก” มันทำงานอย่างไร
คิดว่ามันเป็นรายการตรวจสอบของทริกเกอร์ความผันผวนทั่วไปที่สามารถลงได้ในขณะที่โลกกำลังเฝ้าดู
สี่เหลี่ยม “บิงโกความผันผวนบางชนิด” นั้นไร้กาลเวลา เช่น ธนาคารกลางและการเมืองทางภูมิศาสตร์อื่นๆ มีความทันสมัยมากขึ้น เช่น ความเสี่ยงต่อการหยุดชะงักทางไซเบอร์ การเคลื่อนไหวด้านสภาพภูมิอากาศ และจุดระเบิดทางสังคมรอบโลจิสติกส์โฮสต์ซิตี้
มาโครและนโยบาย
ธนาคารกลางช็อก
เมื่อความคาดหวังของนโยบายเปลี่ยนไป ตลาดสามารถเคลื่อนไหวได้โดยไม่คำนึงถึงปฏิทิน
ลอนดอน 2012 เป็นการเตือนความจำว่าเรื่องนี้ไม่ใช่กีฬามันคือยูโรโซนในปลายเดือนกรกฎาคม 2012 ประธานอีซีบีมาริโอ ดรากี ได้กล่าวว่า “อะไรก็ตาม” ของเขาในลอนดอน ในช่วงเวลาที่ความเครียดของอธิปไตยเป็นหัวข้อความผันผวนที่โดดเด่น
ความเครียดมาโครกำลังดำเนินอยู่แล้ว
ปักกิ่ง 2008 เกิดขึ้นในปีหนึ่งที่กำหนดโดยวิกฤตทางการเงินทั่วโลก โดยมีความผันผวนเชื่อมโยงกับความเครียดด้านเครดิตและความต้องการความเสี่ยงในการปรับราคา ไม่ใช่กับเหตุการณ์นั้นเกมส์จัดขึ้นตั้งแต่วันที่ 8 สิงหาคม 2008 ถึง 24 สิงหาคม ค.
ภูมิศาสตร์และความปลอดภัย
เวลาความขัดแย้งระดับภูมิภา
ในช่วงปักกิ่ง 2008 ความขัดแย้งรัสเซีย-จอร์เจียรุนแรงขึ้นในช่วงต้นเดือนสิงหาคม 2008 โดยทับซ้อนกับช่วงโอลิมปิกบทเรียนของตลาดคือการปรับราคาทางภูมิศาสตร์ไม่ได้หยุดชั่วคราวสำหรับการออกอากาศที่สำคัญ
ความเสี่ยง “หลังพิธีปิด”
ปักกิ่ง 2022 สิ้นสุดลงเมื่อวันที่ 20 กุมภาพันธ์ 2022การรุกรานยูเครนของรัสเซียเต็มรูปแบบเริ่มขึ้นเมื่อวันที่ 24 กุมภาพันธ์ 2022 เพียงไม่กี่วันต่อมา
นี่คือ “สี่เหลี่ยมบิงโก” แบบคลาสสิกเพราะมันเสริมสร้างหลักการเดียวกันการรุนแรงทางภูมิศาสตร์สามารถลงใกล้กับหน้าต่างเหตุการณ์ทั่วโลกโดยไม่จำเป็นต้องเกิดจากมัน
เหตุการณ์ความปลอดภัย หัวเรื่องช็อค
การแข่งขันกีฬาโอลิมปิกยังได้รับผลกระทบโดยตรงจากเหตุการณ์ด้านความปลอดภัยแม้ว่าเหตุการณ์เหล่านั้นจะไม่ใช่ “ตัวขับตลาด” ด้วยตัวเองก็ตาม
สองตัวอย่างทางประวัติศาสตร์ที่กำหนดฉากหลังความปลอดภัยที่กว้างขึ้นรอบเหตุการณ์สำคัญ ได้แก่:
- การสังหารหมู่ในมิวนิกในช่วงกีฬาฤดูร้อน 1972
- การทิ้งระเบิดในโอลิมปิกแอตแลนตาปี 1996 ในสวนโอลิมปิก
สภาพอากาศที่ทันสมัย - โฮสต์ซิตี้
การประท้วงด้านสิ่งแวดล้อมและการต่อต้านโอลิ
การเคลื่อนไหวของเมืองโฮสต์ไม่ใช่เรื่องใหม่ แต่ธีมได้มุ่งเน้นสภาพภูมิอากาศและโครงสร้างพื้นฐานมากขึ้น
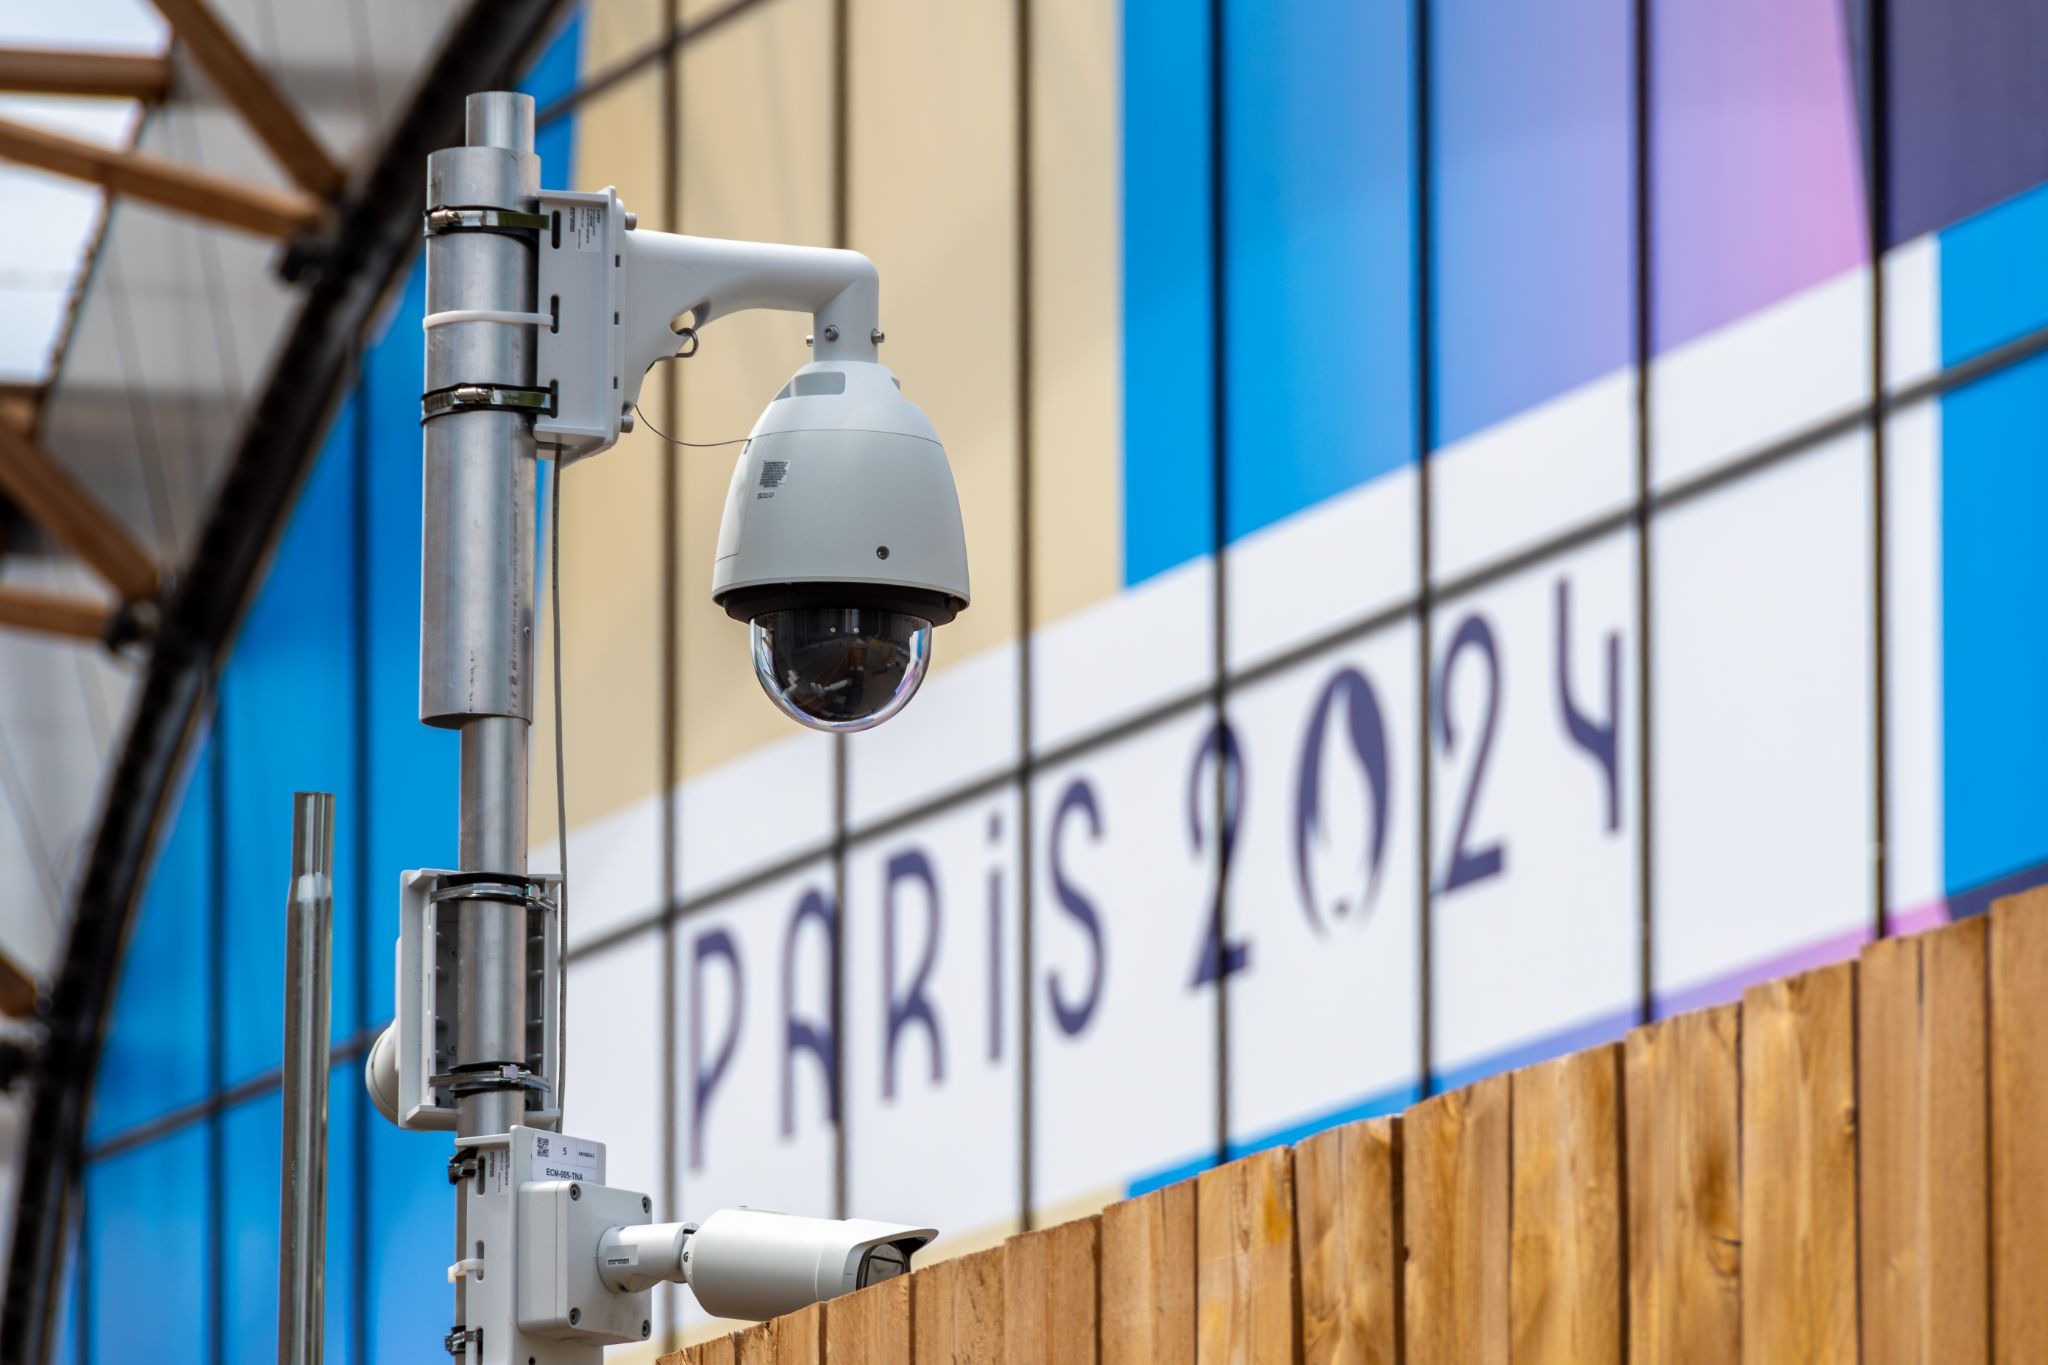
ปารีส 2024 มีการประท้วงและเหตุการณ์ “การเปิดตัว”รายงานรอบปารีสยังอ้างถึงความพยายามประท้วงด้านสิ่งแวดล้อมโดยกลุ่มสภาพภูมิอากาศ
ปัจจุบัน โอลิมปิกฤดูหนาว 2026 เปิดท่ามกลางการประท้วงต่อต้านโอลิมปิกในมิลาน โดยมีการรายงานที่กล่าวถึงการก่อการรบฏกรรมทางรถไฟและการประท้วงที่เน้นไปที่ผลกระทบด้านสิ่งแวดล้อมของโครงสร้างพื้นฐานโอลิมปิก
หัวเรื่องประเภทนี้อาจมีความสำคัญต่อตลาดโดยอ้อม ผ่านความเชื่อมั่นความเสี่ยง การหยุดชะงักด้านการขนส่ง การตอบสนองต่อนโยบาย และการจัดกรอบ “ความไม่มั่นคง” ที่กว้างขึ้น
ความเสี่ยงต่อการหยุดชะงัก
ไซเบอร์ “จัตุรัสบิงโก” ได้โดดเด่นมากขึ้นในเกมสมัยใหม่
หน่วยงานความปลอดภัยทางไซเบอร์แห่งชาติของฝรั่งเศส ANSSI รายงานเหตุการณ์ความปลอดภัยทางไซเบอร์ 548 เหตุการณ์ที่มีผลกระทบต่อหน่วยงานที่เกี่ยวข้องกับโอลิมปิก ซึ่งรายงานต่อ ANSSI ระหว่างวันที่ 8 พฤษภาคม 2024 ถึง 8 กันยายน 2024
แม้ว่าเหตุการณ์จะถูกลงอยู่ เหตุการณ์ทางไซเบอร์ยังคงเพิ่มเสียงรบกวนให้กับหัวข่าวและความมั่นใจ
โลจิสติกส์และการโต้เถียงของ “เหตุการณ์สามารถดำเนินได้หรือไม่”
บางครั้งลิงก์ความผันผวนไม่ใช่เกม แต่เป็นการโต้เถียงเกี่ยวกับการส่งมอบ
ปารีส 2024 มีการตรวจสอบระดับสูงรอบแนวแซนและความพร้อมในการจัดกิจกรรม ควบคู่ไปกับการใช้จ่ายสาธารณะอย่างมีนัยสำคัญในการทำความสะอาดแม่น้ำและการอภิปรายอย่างต่อเนื่องเกี่ยวกับความเสี่ยงด้านคุณภาพน้ำ
เรื่องราวด้านสุขภาพและการหยุดชะงัก
ความกังวลด้านสาธารณสุข
Rio 2016 เป็นการเตือนใจว่าเรื่องราวความเสี่ยงต่อสุขภาพสามารถกลายเป็นส่วนหนึ่งของฉากหลังโอลิมปิกแม้ว่าผลกระทบของตลาดจะเป็นทางอ้อม
ความกังวลของ Zika ได้รับการกล่าวถึงอย่างกว้างขวางก่อนการแข่งขันกีฬา รวมถึงการอภิปรายเกี่ยวกับความเสี่ยงในการส่งผ่านทั่วโลกและการแพร่กระจายที่เกี่ยวข้องกับการเดินทาง
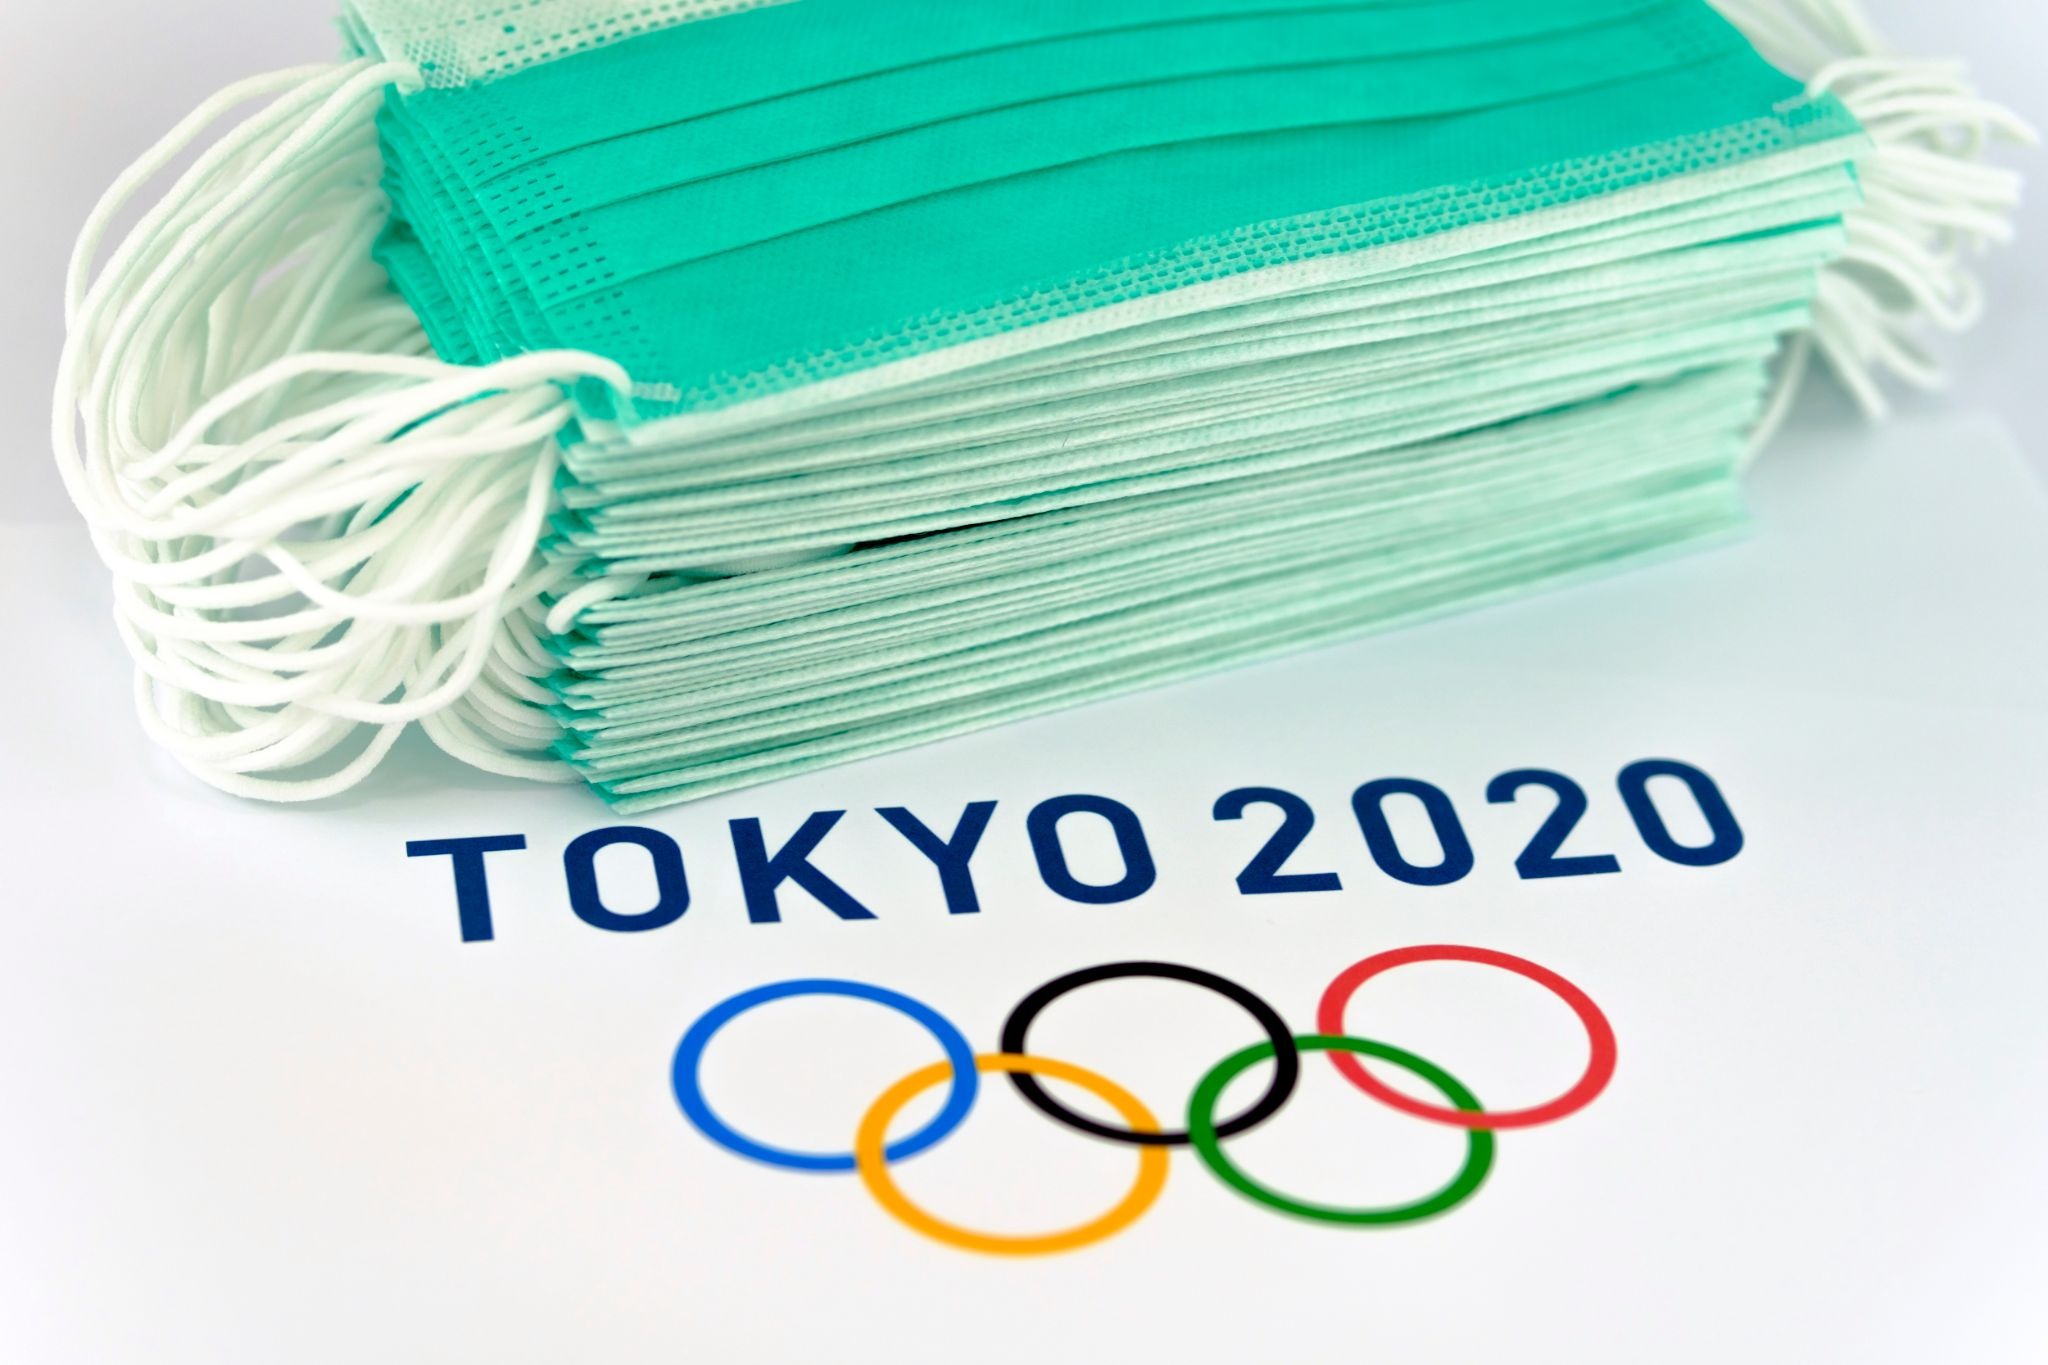
หน่วยความจำ “ยุคการเลื่อนลง”
โตเกียว 2020 ถูกเลื่อนออกไปเป็นปี 2021 เนื่องจากโควิด-19 ซึ่งเน้นย้ำว่าเหตุการณ์ช็อคทั่วโลกสามารถครอบงำทุกอย่างรวมถึงปฏิทินกีฬาที่สำคัญ
ข้อเสนอเชิงปฏิบัติสำหรับผู้ค้า
การเปลี่ยนแปลงยุคโอลิมปิกที่ทำซ้ำได้มากที่สุดมักไม่ใช่ “ความผันผวนมากขึ้น” แต่เงื่อนไขการดำเนินการที่แตกต่างกัน
ในระหว่างเหตุการณ์สำคัญทั่วโลก เทรดเดอร์บางรายเลือกที่จะดูสเปรดและความลึกเพื่อดูสัญญาณของสภาพคล่องที่ลดลง เทรดน้อยลงเมื่อเงื่อนไขดูไม่สม่ำเสมอ และระวังว่าหัวข่าวทางภูมิรัฐศาสตร์ ไซเบอร์ และการประท้วงอาจเกิดขึ้นได้ตลอดเวลา
ในตลาดโลกที่มีขนาดมหาศาล กีฬามักจะไม่ใช่ตัวเร่งปฏิกิริยาสี่เหลี่ยมบิงโกคือ

Reportingdates and release times are based on company investor relations calendars whereconfirmed. Where dates or times are not marked confirmed, they are GO Marketsestimates. Consensus EPS, revenue and analyst-range data are sourced fromBloomberg and Earnings Whispers, as at 09 July 2026 (AEST). Company guidance,backlog and operating metrics are sourced from the latest company filings orresults presentations, unless stated otherwise. Any scenario analysis reflectsGO Markets analysis. Figures and schedules may change without notice.
The information provided is of general nature only and does not take into account your personal objectives, financial situations or needs. Before acting on any information provided, you should consider whether the information is suitable for you and your personal circumstances and if necessary, seek appropriate professional advice. All opinions, conclusions, forecasts or recommendations are reasonably held at the time of compilation but are subject to change without notice. Past performance is not an indication of future performance. Go Markets Pty Ltd, ABN 85 081 864 039, AFSL 254963 is a CFD issuer, and trading carries significant risks and is not suitable for everyone. You do not own or have any interest in the rights to the underlying assets. You should consider the appropriateness by reviewing our TMD, FSG, PDS and other CFD legal documents to ensure you understand the risks before you invest in CFDs.


.jpeg)
