Market news & insights
Stay ahead of the markets with expert insights, news, and technical analysis to guide your trading decisions.

The 8 April ceasefire announcement and parallel discussions around a 45-day truce have not resolved the Strait of Hormuz disruption. They have, for now, capped the worst-case scenario, but tanker traffic remains at a fraction of normal levels and Iran's demand for transit fees signals a structural shift, not a temporary one.
What began as a regional conflict has become a global energy shock, and the question for markets is no longer whether Hormuz was disrupted, but how permanently the disruption changes the pricing floor for oil.
Key takeaways
- Around 20 million barrels per day (bpd) of oil and petroleum products normally pass through the Strait of Hormuz between Iran and Oman, equal to about one-fifth of global oil consumption and roughly 30% of global seaborne oil trade.
- This is a flow shock, not an inventory problem. Oil markets depend on continuous throughput, not static storage.
- If the disruption persists beyond a few weeks, Brent could shift from a short-term spike to a broader price shock, with stagflation risk.
- Tanker traffic through the strait fell from around 135 ships per day to fewer than 15 at the peak of disruption, a reduction of approximately 85%, with more than 150 vessels anchored, diverted, or delayed.
- A two-week ceasefire was announced on 8 April, with 45-day truce negotiations under way. Iran has separately signalled a demand for transit fees on vessels using the strait, which, if formalised, would represent a permanent geopolitical floor on energy costs.
- Markets have begun rotating away from growth and technology exposure toward energy and defence names, reflecting a view that elevated oil is becoming a structural cost rather than a temporary risk premium.
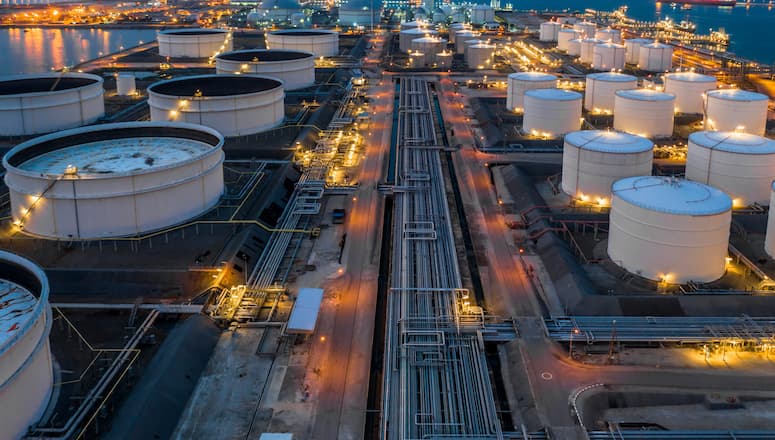
The world’s most critical oil chokepoint
The Strait of Hormuz handles roughly 20 million barrels per day of oil and petroleum products, equal to about 20% of global oil consumption and around 30% of global seaborne oil trade. With global oil demand near 104 million bpd and spare capacity limited, the market was already tightly balanced before the latest escalation.
The strait is also a critical corridor for liquefied natural gas. Around 290 million cubic metres of LNG transited the route each day on average in 2024, representing roughly 20% of global LNG trade, with Asian markets the main destination.
The International Energy Agency (IEA) has described Hormuz as the world’s most important oil transit chokepoint, noting that even partial interruptions may trigger outsized price moves. Brent crude has moved above US$100 a barrel, reflecting both physical tightness and a rising geopolitical risk premium.

Tankers idle as flows slow
Shipping and insurance data now point to strain in real time. More than 85 large crude carriers are reported to be stranded in the Persian Gulf, while more than 150 vessels have been anchored, diverted or delayed as operators reassess safety and insurance cover. That would leave an estimated 120 million to 150 million barrels of crude sitting idle at sea.
Those volumes represent only six to seven days of normal Hormuz throughput, or a little more than one day of global oil consumption.
Updated shipping and insurance data now confirm more than 150 vessels have been anchored, diverted, or delayed, up from the 85 initially reported. The 1.3 days of global consumption coverage from idle crude remains the binding constraint: this is a flow shock, not a storage problem, and the ceasefire has not yet translated into meaningfully restored throughput.
A market built on flow, not storage
Oil markets function on continuous movement. Refineries, petrochemical plants and global supply chains are calibrated to steady deliveries along predictable sea lanes. When flows through a chokepoint that carries roughly one-fifth of global oil consumption and around 30% of global seaborne oil trade are interrupted, the system can move from equilibrium to deficit within days.
Spare production capacity, largely concentrated within OPEC, is estimated at only 3 million to 5 million bpd. That falls well short of the volumes at risk if Hormuz flows are severely disrupted.
Oil market analysis
How long do idle tankers last?
135M idle barrels — days of cover against each demand benchmark

vs. Strait of Hormuz daily flow (20M bbl/day)
vs. Global oil consumption (104M bbl/day)
vs. US Strategic Petroleum Reserve release (1M bbl/day)
135M
idle barrels on tankers (midpoint of 120–150M range)
~33%
of daily Hormuz flow that is idle storage, not transit
<31 hrs
is all idle storage against global daily consumption
Inflation risks and macro spillovers
The inflationary impact of an oil shock typically arrives in waves. Higher fuel and energy prices may lift headline inflation quickly as petrol, diesel and power costs move higher.
Over time, higher energy costs may pass through freight, food, manufacturing and services. If the disruption persists, the combination of elevated inflation and slower growth could raise the risk of a stagflationary environment and leave central banks facing a difficult trade-off.
No easy offset, a system with little slack
What makes the current episode particularly acute is the lack of slack in the global system.
Global supply and demand near 103 million to 104 million bpd leave little spare cushion when a chokepoint handling nearly 20 million bpd, or about one-fifth of global oil consumption, is compromised. Estimated spare capacity of 3 million to 5 million bpd, mostly within OPEC, would cover only a fraction of the volumes at risk.
Alternative routes, including pipelines that bypass Hormuz and rerouted shipping, can only partly offset lost flows, and usually at higher cost and with longer lead times.
Bottom line
Until transit through the Strait of Hormuz is restored and seen as credibly secure, global oil flows are likely to remain impaired and risk premia elevated. For investors, policymakers and corporate decision-makers, the core question is whether oil can move where it needs to go, every day, without interruption.


Mastercard Inc. (NYSE: MA) announced the latest financial results for the previous quarter before the market open on Thursday. World’s third largest financial services company beat both revenue and earnings per share (EPS) estimates for Q4 2022. The company reported revenue of $5.817 billion vs. $5.793 billion estimate.
EPS at $2.65 per share in Q4 vs. $2.575 per share expected. CEO commentary ''We closed out the year with strong financial results and notable wins which will help us capitalize on the tremendous secular shift to digital payments,'' Michael Miebach, CEO of the company said in a press release. ''As we look at the broader economy, we see the continued recovery of cross-border travel, with volumes up 59% versus a year ago and we’re encouraged by Asia opening up further. While macroeconomic and geopolitical uncertainty persists, consumer spending has been remarkably resilient.
We are well prepared to adjust our investment profile quickly if needed,'' Miebach concluded. Stock reaction Share price of Mastercard dipped by around 2% on Thursday, trading at around $374 a share. Stock performance 1 month: +7.91% 3 months: +17.65% Year-to-date: +8.06% 1 year: +7.19% Mastercard stock price targets Baird: $410 Barclays: $427 Truist Securities: $450 Jefferies: $430 Keybanc: $425 UBS: $441 Wells Fargo: $405 Mizuho: $380 Morgan Stanley: $437 Mastercard is the 19 th largest company in the world with a market cap of $363.31 billion.
You can trade Mastercard Inc. (NYSE: MA) and many other stocks from the NYSE, NASDAQ, HKEX, ASX, LSE and DE with GO Markets as a Share CFD. Sources: Mastercard Inc., TradingView, MarketWatch, MetaTrader 5, Benzinga, CompaniesMarketCap

Microsoft Corporation (NASDAQ: MSFT) reported the latest financial results on Wall Street after the market close on Tuesday. Let’s take a closer look at the results. The US technology giant reported revenue of $52.747 billion for quarter ending on December 31, 2022 (up by 2% year-over-year), narrowly falling short of $52.987 billion revenue expected.
Earnings per share (EPS) reported at $2.32 per share (down 6% year-over-year) vs. $2.293 per share estimate. CEO and CFO commentary ''The next major wave of computing is being born, as the Microsoft Cloud turns the world’s most advanced AI models into a new computing platform,'' CEO of Microsoft, Satya Nadella looked into the future of the company. ''We are committed to helping our customers use our platforms and tools to do more with less today and innovate for the future in the new era of AI,'' Nadella concluded. Amy Hood, CFO: ''We are focused on operational excellence as we continue to invest to drive growth.
Microsoft Cloud revenue was $27.1 billion, up 22% (up 29% in constant currency) year-over-year as our commercial offerings continue to drive value for our customers.'' Stock reaction Shares of Microsoft were down by 0.22% at market close on Tuesday, trading at $241.56 a share. The stock was up by around 4% in the after-hours. Stock performance 1 month: +2.14% 3 months: -3.44% Year-to-date: +0.93% 1 year: -16.10% Microsoft stock price targets High: $365.00 Median: $280.00 Low: $212.00 Average: $284.76 Microsoft is the 3 rd largest company in the world with a market cap of $1.804 trillion.
You can trade Microsoft Corporation (NASDAQ: MSFT) and many other stocks from the NYSE, NASDAQ, HKEX, ASX, LSE and DE with GO Markets as a Share CFD. Sources: Microsoft Corporation, TradingView, MarketWatch, MetaTrader 5, WSJ, CompaniesMarketCap

Ethereum and its big brother Bitcoin, have seen one of their most momentous moves since their peaks in November 2021. Various sector wide catalysts worked to move the price down including the collapse of Celsius and FTX which caused shockwaves to the cryptocurrency community. Inflationary pressures also left growth assets reeling in losses, leaving Ethereum beaten down over the last 12 months.
However, there are some signs that it might be starting to turn. From a broader economic perspective there is hope that the Federal Reserve will pivot from its aggressive rate hiking policy to avoid a potential recession which has led to a recent revival of growth assets including cryptocurrency. From a technical perspective the weekly price chart shows a clear head and shoulders pattern that has played out.
The question is whether sell down has finished or if there is further misery to come. The price has seen its range become tighter as it has struggled to break below the key support at $1050. This area also acts as the 200-week moving average adding to its supply.
The volume and volatility have also been reducing as the price has approached this level. The RSI is showing an interesting signal. The RSI has begun trending up which is diverging with the actual price action.
This may indicate that the price is ready to move to the upside in the short term. The 50-week moving average is plateauing indicating that the price is facing some strong support. On the daily chart, the price looks to be coiling with both the 50 day and 200 day moving averages trending up for the first time since before the price peaked in 2021.
Furthermore, it is possible that the 50-day moving average will cross through the 200-day moving average which is very bullish move. The price has also broken above both daily moving averages and may be looking to test the next resistance at $2030. This is also roughly the same price of the neckline of the underlying head and shoulders pattern.
Therefore, a target of $2030 is a reasonable for a short-term long trade/ Ultimately, the price of Ethereum looks like it may be ready to reverse however, it is still at the mercy of the broader Cryptocurrency sector news and macroeconomic catalysts.
The price of Natural Gas has continued its drive back down after peaking in the middle of last year. The price has had an aggressive sell off after an equally aggressive run during the initial stages of the Russian and Ukraine conflict. This was due to Russian gas exports being banned and elevated inflation levels.
However, as the conflict has subsided the price of gas has returned to its seasonal trends. In addition, in recent weeks warmer weather has reduced the reliance on the energy source for much of Europe. The chart from a technical perspective is exceptionally bearish.
For the better part of a decade the price was ranging between 1.5 – 6.5. The aggressive move in 2022 as discussed was due to the beginning of the Russia and Ukraine crisis. The price since then looks to have made a head and shoulders pattern which is a bearish reversal pattern.
The neckline was at 5.5 and was broken through. The price has also broken down through the 200-day EMA on fairly aggressive volume. By zooming out, it can be seen that the recent sell off has been the price moving back into its long-term consistent range.
Therefore, the price should be nearing a bottom. As the price approaches 1.5/2 it may become a good opportunity for a long trade. An initial target at the top of the range of 6.6 could be a reasonable target for this medium-term swing trade.
The daily chart confirms this move and shows how the price has broken through the mid-level of support at 3.5. The daily chart also shows how the volume has been reducing significantly indicating some potential exhaustion in the short term and a spike in buying may be favorable for an upward thrust in price. Ultimately, the price of Gas could gain momentum if Europe’s winter brings about cooler weather or if China’s demand increases as it moves out of its Covid 19 restrictions increasing demand.
With volatility still high for the price of a natural gas caution should still be had when placing a trade.

The outlook for the Australian equities market is one of the best globally and is set up to cope with a potential recession. The Australian market showed itself to be robust in much of the volatility and downturn of last year being one of the more solid economies. This relative strength has carried so far into 2023 and has largely been due to the resource heavy nature of the ASX with most companies on the index being large resource and mining.
The XJO was also geographically protected from much of the geopolitical conflict in Europe that many European markets had to suffer through. The XJO is currently just 300 points off its all time high and with improving commodity prices it is well placed to weather a recessionary storm. A reopening of China may further support growth of the Australian market because growth in China may help various sectors such as travel, construction, manufacturing, and resources.
Lastly, as the Central banks across the world look at lowering interest rates it will only help growth economies such as Australia. Risk assets such as the Technology sector and growth economies should benefit as the cost of borrowing comes down. Although Banks will have to balance the need to lower rates with the need to tame inflation and the fight between which is a worse evil to fight will be much of the talking point of 2023.
Technical Analysis As stated above the XJO is currently just about 300 points below its all-time highs and is trending towards that target. Firstly, on the weekly chart the XJO has been able to maintain a tight range over the last 2 years. Once the dust had settled after the Covid 19 pandemic the price developed a range between 6412 and 7634.
The price also bounced of 6412 its long-term support twice in 2022 before pushing higher. Importantly, since October 2022, the XJO has been able to stay above the 50-week moving average as it has gained momentum. On the daily chart the price has broken to level not seen since April 2022.
Therefore, it is likely that the price may face some significant resistance as it approached 7600. Another positive sign is that the short term 50 day moving average has crossed back over the longer term 200 day moving average. This indicates that momentum is beginning to shift towards the bulls.
With more information still to come out, the Australian equities market is as well placed as any to deal with any potential macroeconomic factors that come its way.

TSMC posts strong Q4 results – the stock is rising Taiwan Semiconductor Manufacturing Company Limited (NYSE: TSM) reported Q4 financial results before the market open in the US on Thursday. The Taiwanese company reported revenue of $20.554 billion for Q4, falling slightly short of Wall Street estimate of $20.574 billion. TSMC reported earnings per share (EPS) of $1.875% for the quarter, higher than $1.795 EPS expected.
CFO commentary ''Our fourth quarter business was dampened by end market demand softness, and customers’ inventory adjustment, despite the continued ramp-up for our industry-leading 5nm technologies,'' Wendell Huang, VP and CFO said after the results. ''Moving into first quarter 2023, as overall macroeconomic conditions remain weak, we expect our business to be further impacted by continued end market demand softness, and customers’ further inventory adjustment,'' Huang looked ahead. The company expects the revenue of between $16.7 billion and $17.5 billion for Q1. Stock reaction Shares of TSMC were up by over 7% on Thursday at $88.07 a share.
Stock performance 1 month: 3 months: Year-to-date: 1 year: TSMC price targets Susquehanna: $88 Atlantic Equities: $170 Cowen & Co.: $120 Argus Research: $150 Goldman Sachs: $55 Taiwan Semiconductor Manufacturing Company Limited is the 10 th largest company in the world with a market cap of $454.97 billion. You can trade Taiwan Semiconductor Manufacturing Company Limited (NYSE: TSM) and many other stocks from the NYSE, NASDAQ, HKEX, ASX, LSE and DE with GO Markets as a Share CFD. Sources: Taiwan Semiconductor Manufacturing Company Limited, TradingView, MarketWatch, MetaTrader 5, Benzinga, CompaniesMarketCap