
Natural Gas prices have had a volatile year to say the least. After finding multi decade highs on the back of geo-political volatility and record high inflation levels the price has seen an aggressive retracement. With the overall commodities market suffering a big drop as recessionary pressures have taken over and a resilient USD, Natural gas has seen a 30 per cent drop from its peak.
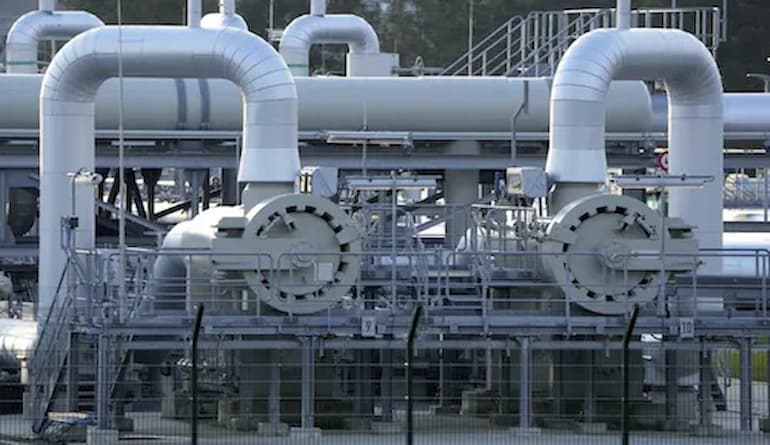
News about leaks in the Nord Stream 1 Pipeline and Russia's control over much of the rest of Europe's supply has seen an increase of volatility and with Europe entering winter soon and the surety of supply still on a knifes edge, the market remains volatile. Looking at the recent price action of Natural Gas, the long-term chart shows that the current price is sitting on a strong area of support at 6 USD. Not only is the price sitting on a strong area of support, the area also doubles as the 200-day average.
The weekly candle is a Doji showing indecision as buyers and sellers look to find the equilibrium price. By comparing both the RSI from the weekly and daily charts its can be observed that there is interesting divergence of patterns. On the weekly timeframe, the RSI is consolidating into a symmetrical triangle whilst the daily RSI shows a bounce off the oversold zone.
This may provide a clue as to which direction the price may go next. If the price continues to bounce off the oversold level, it may indicate a longer-term break on the weekly chart. This bounce would provide an obvious target for a reversal to the long side to the top of the range at 10 USD.
With general market volatility still quite high and commodities seeing aggressive moves, the next 6-12 months may provide some interesting trading opportunities for natural gas in both directions.

The information provided is of general nature only and does not take into account your personal objectives, financial situations or needs. Before acting on any information provided, you should consider whether the information is suitable for you and your personal circumstances and if necessary, seek appropriate professional advice. All opinions, conclusions, forecasts or recommendations are reasonably held at the time of compilation but are subject to change without notice. Past performance is not an indication of future performance. Go Markets Pty Ltd, ABN 85 081 864 039, AFSL 254963 is a CFD issuer, and trading carries significant risks and is not suitable for everyone. You do not own or have any interest in the rights to the underlying assets. You should consider the appropriateness by reviewing our TMD, FSG, PDS and other CFD legal documents to ensure you understand the risks before you invest in CFDs.


