The information provided is of general nature only and does not take into account your personal objectives, financial situations or needs. Before acting on any information provided, you should consider whether the information is suitable for you and your personal circumstances and if necessary, seek appropriate professional advice. All opinions, conclusions, forecasts or recommendations are reasonably held at the time of compilation but are subject to change without notice. Past performance is not an indication of future performance. Go Markets Pty Ltd, ABN 85 081 864 039, AFSL 254963 is a CFD issuer, and trading carries significant risks and is not suitable for everyone. You do not own or have any interest in the rights to the underlying assets. You should consider the appropriateness by reviewing our TMD, FSG, PDS and other CFD legal documents to ensure you understand the risks before you invest in CFDs. These documents are available here.
Any references to Australian or international shares, sectors, indices, ETFs, crypto-related stocks or other instruments are provided for market commentary and watchlist purposes only and do not constitute a recommendation, offer or solicitation to buy, sell or hold any financial product or adopt any investment strategy. International markets may involve additional risks, including currency fluctuations, regulatory differences, market structure differences, reduced liquidity and higher volatility. Company-specific, sector-specific and macroeconomic risks may also affect performance.
Commentary on geopolitical developments, economic data, central bank decisions, earnings, policy changes and other global or financial market events is based on information available at the time of publication and may change without notice. Such events can lead to sudden market moves, price gaps, reduced liquidity, wider spreads and increased volatility, particularly in leveraged products such as CFDs. Forward-looking statements, expectations and scenario analysis are inherently uncertain and should not be relied on as guarantees of future market behaviour or outcomes.
黄金受美元回落支撑;在交易员等待美国CPI报告之际,维持在4150美元上方

- 金价在美元从18个月高点回落之际,守稳于4150美元上方。
- 受油价驱动的通胀风险提振美联储加息押注,这应会限制这种无收益的贵金属。
- 交易商也选择等待最新的美国通胀数据和美联储主席沃什的讲话。
周三亚洲时段,黄金(XAU/USD)小幅走高,守在4150美元上方,交易商目前正等待最新的美国通胀数据,然后再建立新的方向性押注。美国消费者物价指数(CPI)将于今日晚些时候公布,随后是周四的生产者物价指数(PPI)。除此之外,美联储(Fed)主席凯文-沃什(Kevin Warsh)将于周五在曼谷举行的国际货币基金组织和世界银行年会上的讲话,也将被视为获取有关未来政策路径更多线索的机会。反过来,这一前景将对美元(USD)走势起到关键作用,并为这种无收益的黄色金属提供一些有意义的推动力。
与此同时,CME集团的美联储观察工具显示,交易商认为美国央行在12月政策会议上再次提高借贷成本的概率接近90%。近期有影响力的FOMC成员发表鹰派言论,暗示在持续的价格压力下,年底前进一步加息的可能性,这提振了这一押注。此外,对能源驱动型通胀风险的担忧支撑了美联储进一步收紧政策的前景,这可能会继续对黄金构成阻力。事实上,由于中东冲突升级引发供应担忧,原油价格升至近两周高点。
过去一周,伊朗支持的胡塞武装与沙特阿拉伯之间的战斗愈演愈烈,以报复沙特对也门政府军的支持。此外,据报胡塞武装在也门的能源终端和燃料储备遭到沙特领导的联军袭击。与此同时,在霍尔木兹海峡对峙之际,美国与伊朗之间的紧张局势也持续发酵。事实上,美国中央司令部驳斥了伊朗伊斯兰革命卫队海军指挥官的说法,即这一战略水道处于伊朗控制之下,任何接近的美国海军军舰都将被击沉。这使地缘政治风险溢价继续存在。
不过,美元连续第二天下滑,进一步远离其自2025年4月以来的最高水平,并为黄金提供了一些支撑。尽管如此,上述偏空的基本面背景使得在为XAU/USD货币对任何有意义的上行空间布局之前,谨慎等待强劲的后续买盘以及突破过去两周左右维持的短期交易区间。
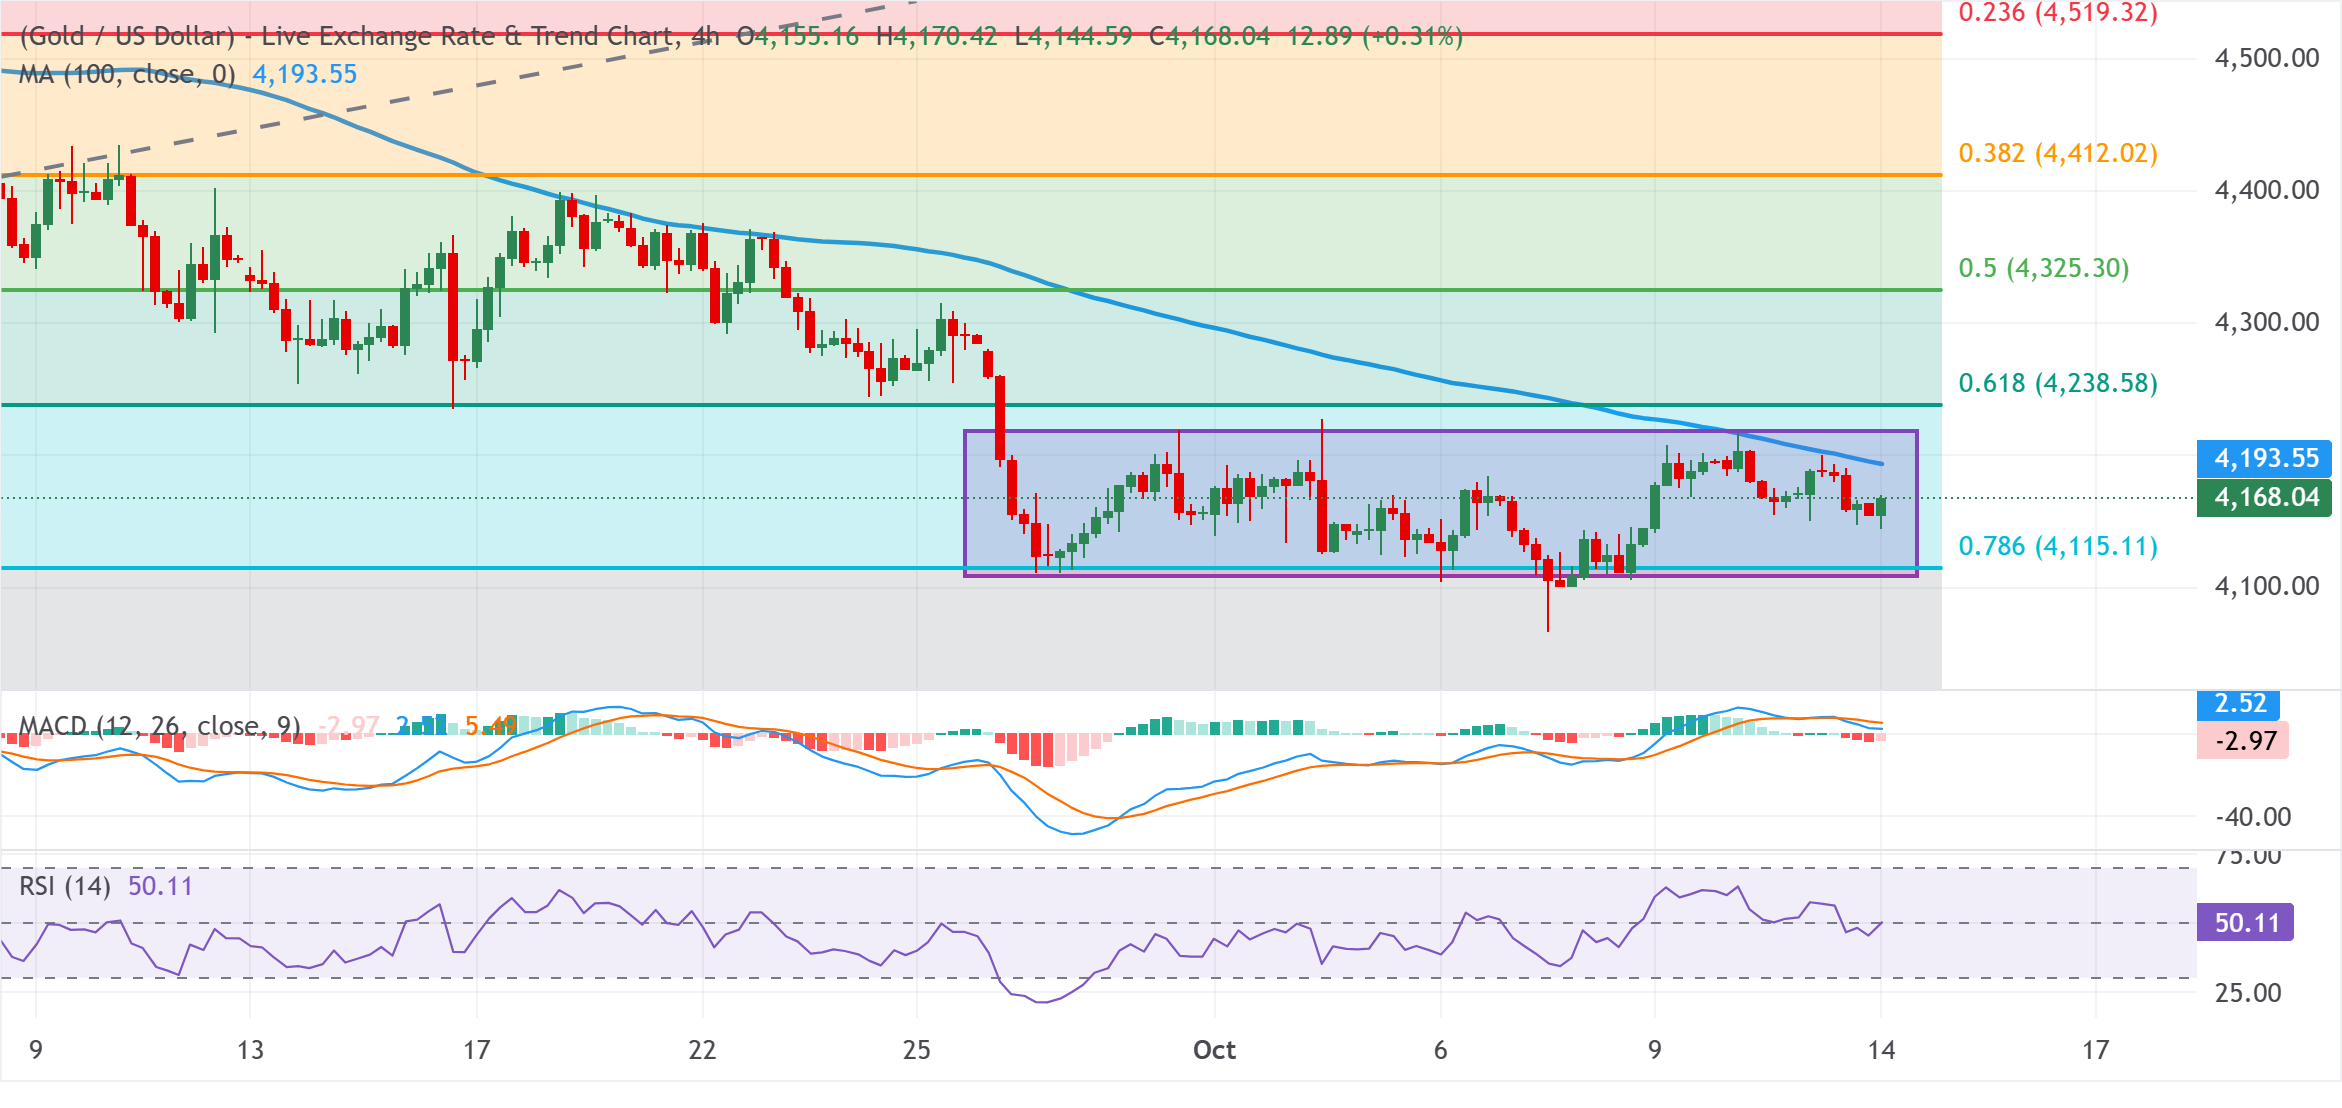
XAU/USD 4小时图
技术分析
撇开上周突然跌至两个月低点不谈,区间震荡的价格走势可能会被归类为看跌盘整阶段,背景是金价自 8 月波段高点回落。然而,金价仍维持在 78.6% 斐波那契回撤位 4,115 美元上方,表明下方存在初步支撑。与此同时,移动平均趋同背离(MACD)指标仍处于负值区域,看跌柱状图略有收缩,暗示下行压力正在减弱。相对强弱指数(RSI)在 50 附近,指向中性动能,进一步强化了其在更大修正阶段内盘整的观点,而非开启新的上涨行情。
因此,后续任何上涨都可能继续在 4 小时图上的 100 周期简单移动平均线(SMA)4,193 美元处遭遇强劲阻力。其后是交易区间上沿,位于 4,215-4,220 美元区域附近,以及 61.8% 斐波那契回撤位 4,238 美元,进一步阻力位见于 4,325 美元,对应 50.0% 回撤位。再往上,38.2% 回撤位 4,412 美元和 23.6% 回撤位 4,519 美元标志着逐步增强的供应区。下行方面,直接支撑位见于 78.6% 回撤位 4,115 美元,其前方是前一周期低点区域 3,957.83 美元。若持续跌破 4,115 美元,可能会为进一步下探至该下方结构性底部打开空间。
(本故事的技术分析由 AI 工具协助撰写。 了解更多。)
下表显示了 美元 (USD) 对所列主要货币 今日的变动百分比。[货币名称]对[货币名称]最强。
| USD | EUR | GBP | JPY | CAD | AUD | NZD | CHF | |
|---|---|---|---|---|---|---|---|---|
| USD | -0.11% | -0.14% | -0.08% | -0.11% | -0.18% | -0.23% | -0.09% | |
| EUR | 0.11% | -0.03% | 0.05% | 0.00% | -0.08% | -0.16% | 0.00% | |
| GBP | 0.14% | 0.03% | 0.08% | 0.02% | -0.05% | -0.11% | 0.04% | |
| JPY | 0.08% | -0.05% | -0.08% | -0.02% | -0.11% | -0.14% | -0.00% | |
| CAD | 0.11% | -0.00% | -0.02% | 0.02% | -0.08% | -0.13% | 0.00% | |
| AUD | 0.18% | 0.08% | 0.05% | 0.11% | 0.08% | -0.04% | 0.08% | |
| NZD | 0.23% | 0.16% | 0.11% | 0.14% | 0.13% | 0.04% | 0.15% | |
| CHF | 0.09% | -0.00% | -0.04% | 0.00% | -0.01% | -0.08% | -0.15% |
热图显示了主要货币相对于其他货币的百分比变化。基础货币从左列中选取,而报价货币从顶部行中选取。例如,如果您从左列选择 美元 并沿着水平线移动到 日元 ,则框中显示的百分比变化将表示 USD (基数)/ JPY (报价)。
Related Articles