The information provided is of general nature only and does not take into account your personal objectives, financial situations or needs. Before acting on any information provided, you should consider whether the information is suitable for you and your personal circumstances and if necessary, seek appropriate professional advice. All opinions, conclusions, forecasts or recommendations are reasonably held at the time of compilation but are subject to change without notice. Past performance is not an indication of future performance. Go Markets Pty Ltd, ABN 85 081 864 039, AFSL 254963 is a CFD issuer, and trading carries significant risks and is not suitable for everyone. You do not own or have any interest in the rights to the underlying assets. You should consider the appropriateness by reviewing our TMD, FSG, PDS and other CFD legal documents to ensure you understand the risks before you invest in CFDs. These documents are available here.
Any references to Australian or international shares, sectors, indices, ETFs, crypto-related stocks or other instruments are provided for market commentary and watchlist purposes only and do not constitute a recommendation, offer or solicitation to buy, sell or hold any financial product or adopt any investment strategy. International markets may involve additional risks, including currency fluctuations, regulatory differences, market structure differences, reduced liquidity and higher volatility. Company-specific, sector-specific and macroeconomic risks may also affect performance.
Commentary on geopolitical developments, economic data, central bank decisions, earnings, policy changes and other global or financial market events is based on information available at the time of publication and may change without notice. Such events can lead to sudden market moves, price gaps, reduced liquidity, wider spreads and increased volatility, particularly in leveraged products such as CFDs. Forward-looking statements, expectations and scenario analysis are inherently uncertain and should not be relied on as guarantees of future market behaviour or outcomes.
日元因美元走软限制盘中跌幅而难以获得明确方向

- 美元/日元在日本疲弱的宏观数据推动下,盘中小幅上涨后吸引了新的卖盘。
- 日本央行(BoJ)加息押注和迫在眉睫的干预风险支撑日元,限制该货币对的涨幅。
- 疲软的美元进一步对现货价格构成压力,不过下行空间似乎有限。
周五,美元/日元货币对难以利用亚洲时段的小幅上涨,目前在广泛走弱的美元(USD)背景下,交投于日内区间下沿、158.00关口下方。不过,受喜忧参半的基本面信号影响,现货价格仍被限制在过去一周左右的熟悉区间内。
日本家庭支出在8月份连续第九个月收缩,今日早些时候公布的数据令日元(JPY)略微走软。不过,降幅小于预期,这与日本实际工资连续第八个月上升相叠加,进一步巩固了市场对日本央行(BoJ)进一步收紧政策的押注。此外,交易员仍高度警惕有关当局可能出手支撑日元的猜测。这一点,再加上美元小幅走弱,继续对美元/日元货币对构成压力。
日本央行逐步收紧政策削弱日元的套利交易吸引力
荷兰合作银行(Rabobank)的外汇策略师指出:“尽管日本央行在9月政策会议上如预期加息,但其前瞻指引并没有市场原本希望的那么鹰派。”尽管如此,他们认为,“日本央行逐步加息的政策仍在削弱日元作为融资货币的吸引力”,因为持续的紧缩周期削弱了日元作为低成本套利交易工具的传统角色。
美国总统特朗普周四表示,在11月3日中期国会选举之前,美国不会恢复对伊朗的军事打击,这抑制了原油价格,并缓解了对通胀失控的担忧。除此之外,一场30年期债券拍卖需求稳健,并引发美国国债收益率回调,拖累追踪美元兑一篮子货币表现的美元指数(DXY)远离18个月高点。这进一步限制了美元/日元货币对的任何实质性上行空间。
与此同时,交易员仍在计入美联储(Fed)12月加息超过80%的概率。除此之外,美国与伊朗就德黑兰核计划的对峙所引发的持续地缘政治不确定性,可能支撑避险美元和美元/日元货币对。事实上,伊朗原子能组织负责人穆罕默德·埃斯拉米(Mohammad Eslami)被引述称,该国不会停止铀浓缩,也不会放弃其铀库存。这使地缘政治风险溢价持续存在,并有利于美元多头。
尽管如此,上述喜忧参半的基本面背景使交易员不愿下激进的方向性赌注,从而导致美元/日元货币对的区间震荡走势。市场参与者现在期待密歇根大学美国消费者信心和通胀预期初值指数的公布。此外,具有影响力的 FOMC 成员的讲话以及即将到来的地缘政治头条将推动美元需求,进而可能在周末前带来短期机会。
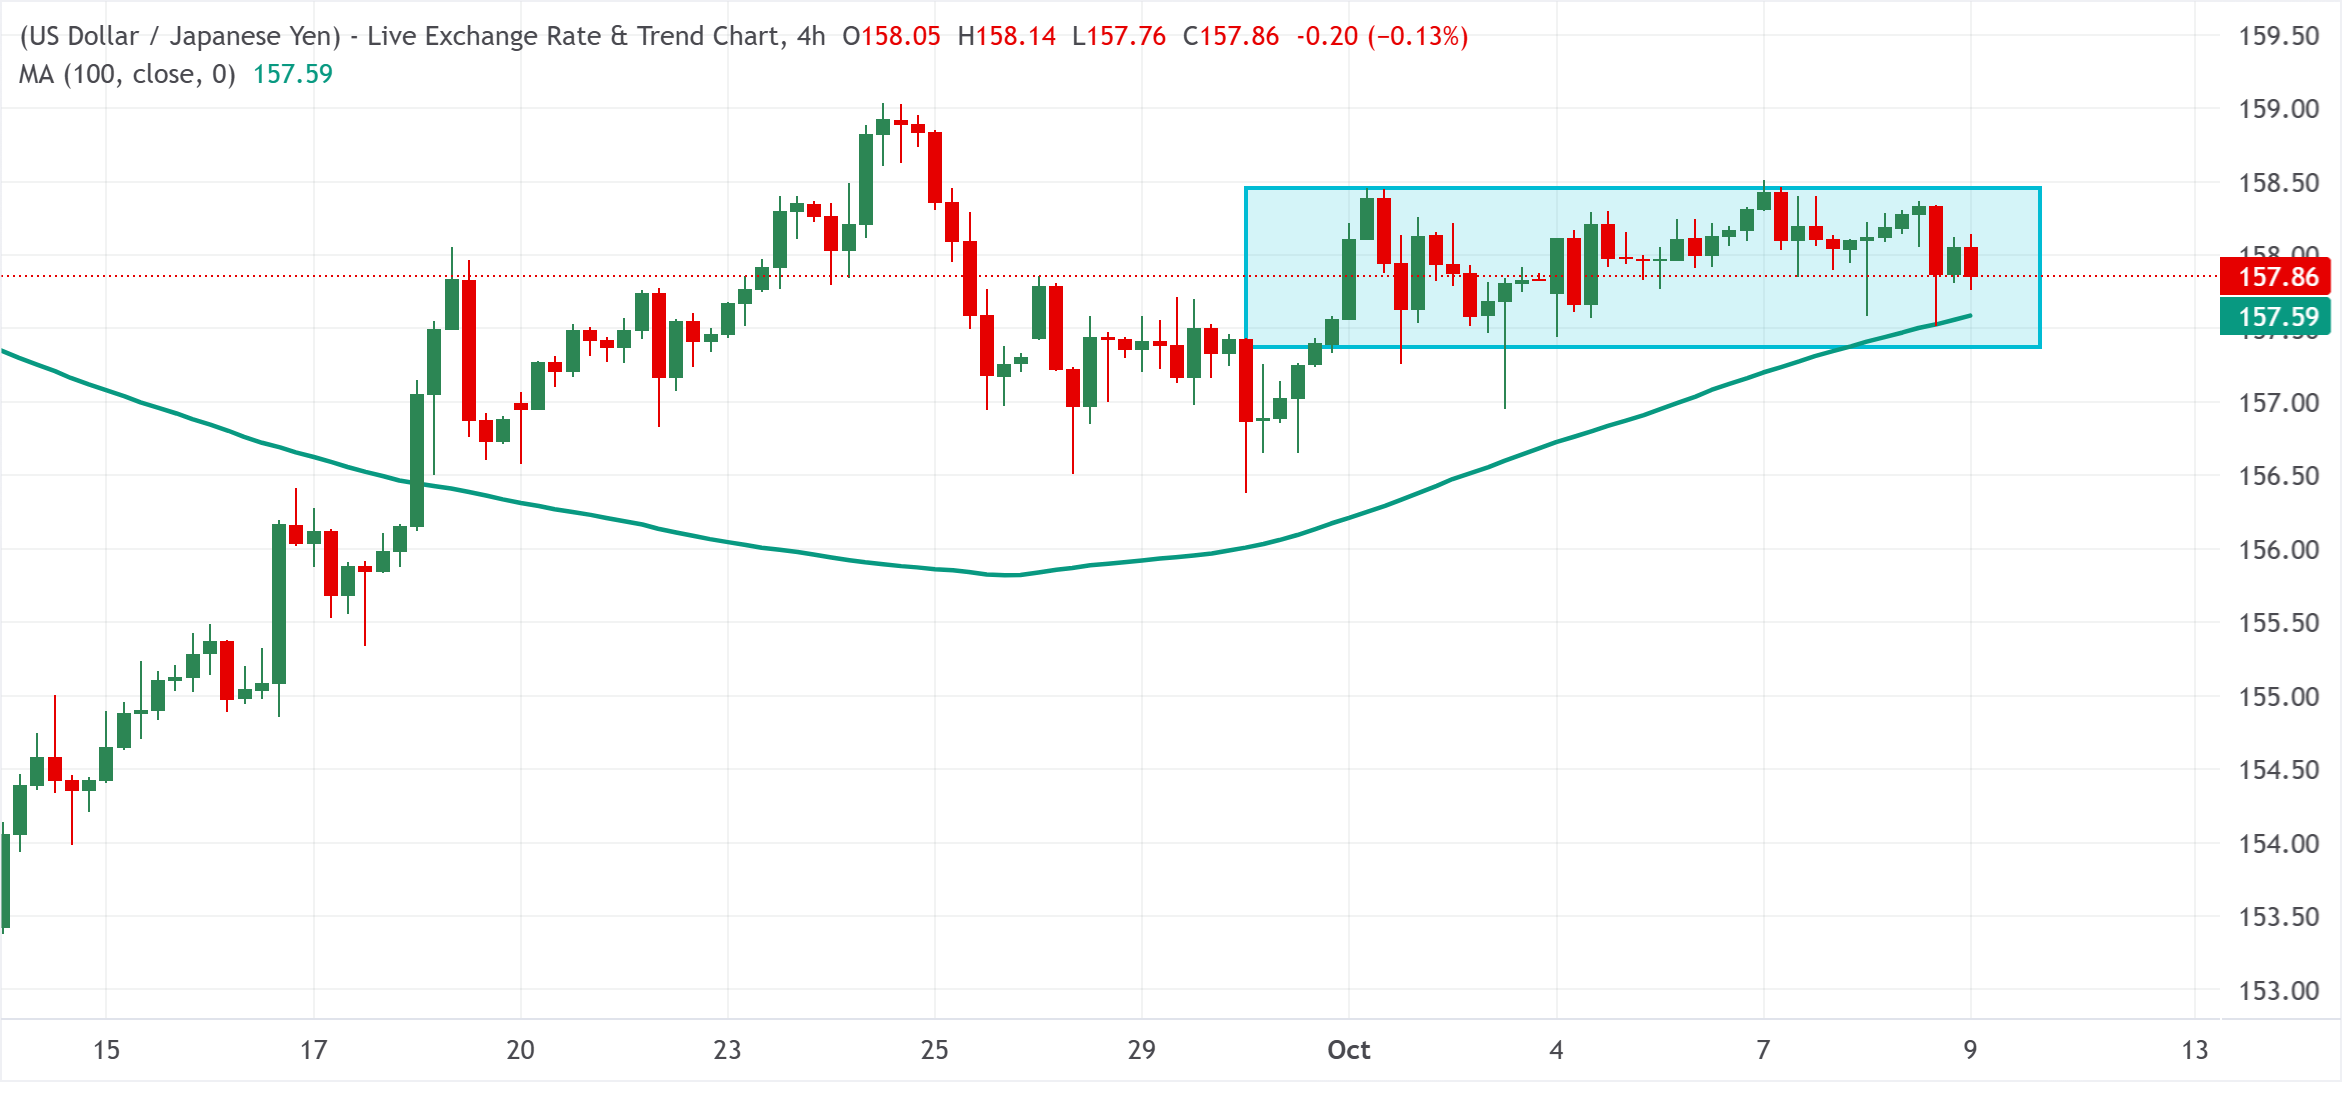
美元/日元 4 小时图
技术分析
美元/日元货币对维持短期看涨倾向,因为其在 4 小时图上保持在 100 周期简单移动平均线(SMA)上方。此外,近期的区间震荡走势仍可归类为看涨盘整阶段,表明尽管缺乏强劲买盘兴趣,更广泛的上升趋势依然完好。
与此同时,初步支撑位于 157.59 区域,100 周期 SMA 在该处提供潜在需求,并在其保持不变时有望缓冲更深的回调。上行方面,158.50 区域,或交易区间上沿,可能构成眼前阻力,而进一步走强将重申积极前景。
(本报道的技术分析由 AI 工具协助撰写。 了解更多。)
下表显示了 美元 (USD) 对所列主要货币 今日的变动百分比。[货币名称]对[货币名称]最强。
| USD | EUR | GBP | JPY | CAD | AUD | NZD | CHF | |
|---|---|---|---|---|---|---|---|---|
| USD | -0.14% | -0.11% | -0.03% | -0.11% | -0.24% | -0.21% | -0.22% | |
| EUR | 0.14% | 0.03% | 0.11% | 0.02% | -0.09% | -0.04% | -0.10% | |
| GBP | 0.11% | -0.03% | 0.08% | 0.02% | -0.11% | -0.05% | -0.07% | |
| JPY | 0.03% | -0.11% | -0.08% | -0.07% | -0.21% | -0.16% | -0.18% | |
| CAD | 0.11% | -0.02% | -0.02% | 0.07% | -0.16% | -0.10% | -0.10% | |
| AUD | 0.24% | 0.09% | 0.11% | 0.21% | 0.16% | 0.05% | 0.06% | |
| NZD | 0.21% | 0.04% | 0.05% | 0.16% | 0.10% | -0.05% | -0.00% | |
| CHF | 0.22% | 0.10% | 0.07% | 0.18% | 0.10% | -0.06% | 0.00% |
热图显示了主要货币相对于其他货币的百分比变化。基础货币从左列中选取,而报价货币从顶部行中选取。例如,如果您从左列选择 美元 并沿着水平线移动到 日元 ,则框中显示的百分比变化将表示 USD (基数)/ JPY (报价)。
Related Articles