The information provided is of general nature only and does not take into account your personal objectives, financial situations or needs. Before acting on any information provided, you should consider whether the information is suitable for you and your personal circumstances and if necessary, seek appropriate professional advice. All opinions, conclusions, forecasts or recommendations are reasonably held at the time of compilation but are subject to change without notice. Past performance is not an indication of future performance. Go Markets Pty Ltd, ABN 85 081 864 039, AFSL 254963 is a CFD issuer, and trading carries significant risks and is not suitable for everyone. You do not own or have any interest in the rights to the underlying assets. You should consider the appropriateness by reviewing our TMD, FSG, PDS and other CFD legal documents to ensure you understand the risks before you invest in CFDs. These documents are available here.
Any references to Australian or international shares, sectors, indices, ETFs, crypto-related stocks or other instruments are provided for market commentary and watchlist purposes only and do not constitute a recommendation, offer or solicitation to buy, sell or hold any financial product or adopt any investment strategy. International markets may involve additional risks, including currency fluctuations, regulatory differences, market structure differences, reduced liquidity and higher volatility. Company-specific, sector-specific and macroeconomic risks may also affect performance.
Commentary on geopolitical developments, economic data, central bank decisions, earnings, policy changes and other global or financial market events is based on information available at the time of publication and may change without notice. Such events can lead to sudden market moves, price gaps, reduced liquidity, wider spreads and increased volatility, particularly in leveraged products such as CFDs. Forward-looking statements, expectations and scenario analysis are inherently uncertain and should not be relied on as guarantees of future market behaviour or outcomes.
Gold tumbles below $4,150 amid elevated US Treasury yields

- Gold price slumps to near $4,135 in Tuesday’s early Asian session.
- US Treasury bond yields move higher, weighing on gold as it pays no interest.
- Markets priced in an 82.8% chance of a Fed rate hold at the meeting next week.
Gold price (XAU/USD) falls to around $4,135 during the early Asian session on Tuesday. The precious metal extends its downside as US bond yields stayed elevated despite falling energy prices. Traders continue to assess the outlook for US interest rates ahead of next week’s Federal Reserve (Fed) policy meeting.
The 2-year Treasury note yield, which more closely follows short-term Fed rate decisions, increased more than 3 basis points (bps) at 4.778%. Meanwhile, the 10-year US Treasury yield climbed more than 4 bps to 5.144%. The 30-year US Treasury bond yield rose more than 4 bps higher at 5.476%.
Higher US bond yields also came from a selloff in French bonds following a weekend of violent unrest. Higher rates are generally a headwind for gold as it pays no interest.
The Fed raised interest rates by a quarter of a percentage point in September, marking its first rate hike since 2023. Nonetheless, traders calibrate the US central bank’s next move after comments by Chairman Kevin Warsh were interpreted as supporting the case to keep rates steady this month.
The Fed is widely expected to hold interest rates steady in its October policy meeting despite last week’s strong US inflation readings. Fed funds futures are pricing in an implied 82.8% odds that the US central bank stays on hold at its next two-day meeting on October 28, according to the CME FedWatch tool.
Inflation swaps climb as markets digest last week’s US data
Strategists at Deutsche Bank highlight that, in the US, a relatively light data calendar this week “should leave markets continuing to digest last week’s much stronger-than-expected inflation numbers.” They note that “AI-related growth concerns helped to drive a decent rally for sovereign bonds, with the US 10yr Treasury yield down -16.5bps last week (+1.5bps Friday) to 5.07%.” At the same time, inflation expectations have moved higher on both sides of the Atlantic, with Deutsche Bank pointing out that this “exacerbated inflation concerns in Europe and saw the 1yr Euro inflation swap rise another +21bps last week to +3.69%,” while “similarly in the US, the 1yr inflation swap was up +17bps last week to +2.74%.”
Warsh flags investment surge and AI demand risk while avoiding 2026 policy pre-commitments
Fed Chair Warsh delivered a moderately constructive but slightly less forceful message, with a 5.6/10 FXS Speechtracker score compared to the established baseline of 6.1/10. The admission of being “over-scarred from the global financial crisis” underscores a cautious bias even as Warsh highlights structural growth and an investment surge driven by “good policies,” while stressing that key policy decisions will crystallize at the October and December meetings without pre-judging outcomes. Warsh’s focus on AI as a near-term demand shock with uncertain employment effects, alongside new Fed task forces and a field hearing, signals growing attention to technology-driven macro and financial stability risks that could ultimately shape Dollar dynamics via the policy path.
The FXS Fed Sentiment Index was unchanged on the speech, moving 0.00 points to a still-elevated 127.51, indicating that the overall policy tone remains firmly in hawkish territory despite the slightly softer FXS Speechtracker score. The combination of confidence in delivering price stability, emphasis on an investment-led upswing, and caution about negative tailside risks suggests that, for now, the FXS Fed Sentiment Index continues to flag upside risk for the Dollar relative to a neutral 100 benchmark.
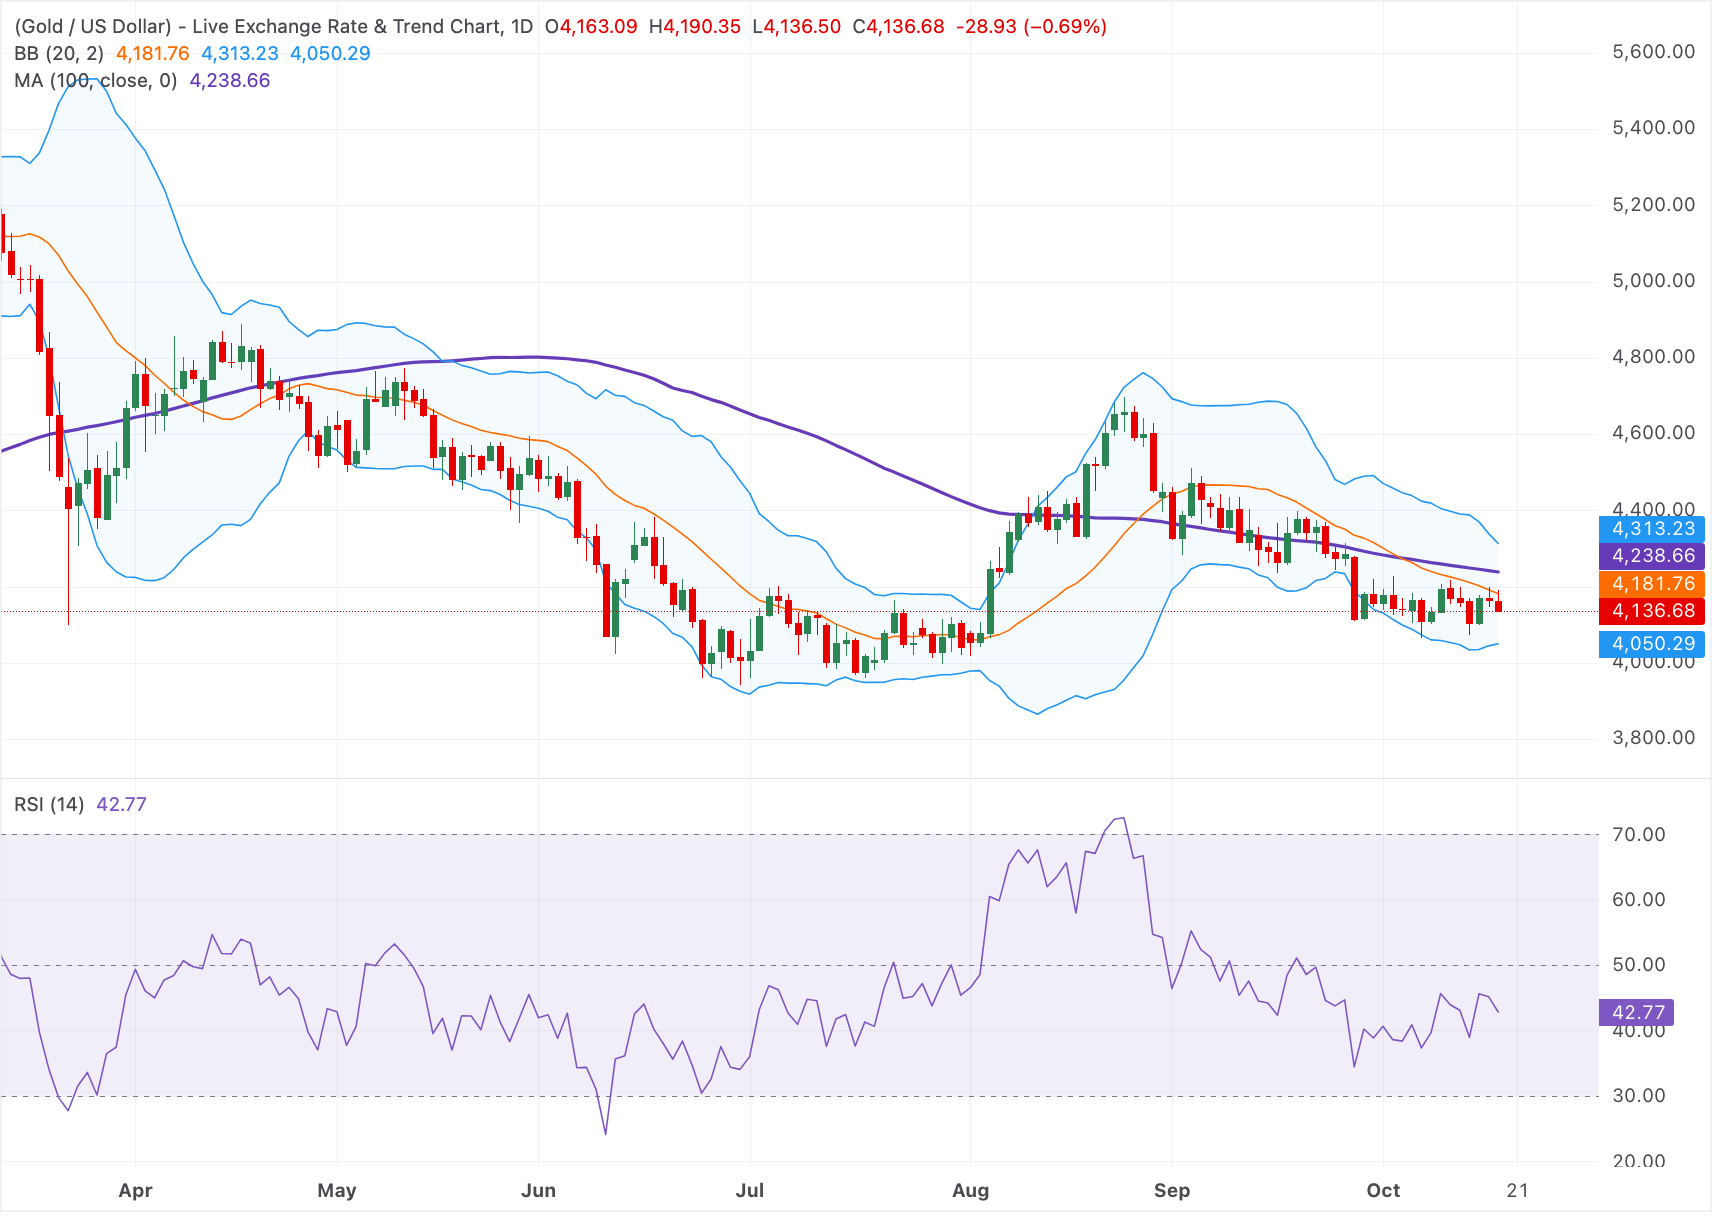
Technical Analysis: Gold remains capped under the key 100-day SMA
In the daily chart, XAU/USD holds a bearish near-term bias as spot remains lodged beneath the 100-day Simple Moving Average (SMA). Price also trades under the Bollinger Bands’ 20-day middle band, reinforcing a capped tone, while the Relative Strength Index (14) near 42 points to weak momentum rather than outright oversold conditions.
On the topside, initial resistance emerges at the Bollinger middle band near $4,180, followed by the 100-day SMA at $4,240 and then the upper Bollinger band close to $4,315, where a break would be needed to ease the current downside pressure. On the downside, the lower Bollinger band offers next support around $4,050; a sustained drop toward or through this band would signal an extension of the corrective phase.
(The technical analysis of this story was written with the help of an AI tool. Know more.)
Gold FAQs
Gold has played a key role in human’s history as it has been widely used as a store of value and medium of exchange. Currently, apart from its shine and usage for jewelry, the precious metal is widely seen as a safe-haven asset, meaning that it is considered a good investment during turbulent times. Gold is also widely seen as a hedge against inflation and against depreciating currencies as it doesn’t rely on any specific issuer or government.
Central banks are the biggest Gold holders. In their aim to support their currencies in turbulent times, central banks tend to diversify their reserves and buy Gold to improve the perceived strength of the economy and the currency. High Gold reserves can be a source of trust for a country’s solvency. Central banks added 1,136 tonnes of Gold worth around $70 billion to their reserves in 2022, according to data from the World Gold Council. This is the highest yearly purchase since records began. Central banks from emerging economies such as China, India and Turkey are quickly increasing their Gold reserves.
Gold has an inverse correlation with the US Dollar and US Treasuries, which are both major reserve and safe-haven assets. When the Dollar depreciates, Gold tends to rise, enabling investors and central banks to diversify their assets in turbulent times. Gold is also inversely correlated with risk assets. A rally in the stock market tends to weaken Gold price, while sell-offs in riskier markets tend to favor the precious metal.
The price can move due to a wide range of factors. Geopolitical instability or fears of a deep recession can quickly make Gold price escalate due to its safe-haven status. As a yield-less asset, Gold tends to rise with lower interest rates, while higher cost of money usually weighs down on the yellow metal. Still, most moves depend on how the US Dollar (USD) behaves as the asset is priced in dollars (XAU/USD). A strong Dollar tends to keep the price of Gold controlled, whereas a weaker Dollar is likely to push Gold prices up.
Related Articles