The information provided is of general nature only and does not take into account your personal objectives, financial situations or needs. Before acting on any information provided, you should consider whether the information is suitable for you and your personal circumstances and if necessary, seek appropriate professional advice. All opinions, conclusions, forecasts or recommendations are reasonably held at the time of compilation but are subject to change without notice. Past performance is not an indication of future performance. Go Markets Pty Ltd, ABN 85 081 864 039, AFSL 254963 is a CFD issuer, and trading carries significant risks and is not suitable for everyone. You do not own or have any interest in the rights to the underlying assets. You should consider the appropriateness by reviewing our TMD, FSG, PDS and other CFD legal documents to ensure you understand the risks before you invest in CFDs. These documents are available here.
Any references to Australian or international shares, sectors, indices, ETFs, crypto-related stocks or other instruments are provided for market commentary and watchlist purposes only and do not constitute a recommendation, offer or solicitation to buy, sell or hold any financial product or adopt any investment strategy. International markets may involve additional risks, including currency fluctuations, regulatory differences, market structure differences, reduced liquidity and higher volatility. Company-specific, sector-specific and macroeconomic risks may also affect performance.
Commentary on geopolitical developments, economic data, central bank decisions, earnings, policy changes and other global or financial market events is based on information available at the time of publication and may change without notice. Such events can lead to sudden market moves, price gaps, reduced liquidity, wider spreads and increased volatility, particularly in leveraged products such as CFDs. Forward-looking statements, expectations and scenario analysis are inherently uncertain and should not be relied on as guarantees of future market behaviour or outcomes.
AUD/USD Price Forecast: Bulls await breakout above 100-day SMA hurdle near 0.7035

- AUD/USD continues its struggle to make it through the critical 100-day SMA pivotal resistance.
- Geopolitical risks and hawkish Fed expectations lend support to the USD, capping spot prices.
- RBA rate hike bets act as a tailwind for the Aussie as the focus remains on the FOMC meeting.
The AUD/USD pair pulls back slightly from a fresh one-month high touched earlier this Monday, failing to decisively break out through the 100-day Simple Moving Average (SMA) pivotal resistance. Spot prices, however, hold above the 0.7000 psychological mark through the first half of the European session as traders seem hesitant to place aggressive directional bets ahead of this week's key central bank event and data risks.
The Australian consumer inflation figures are due for release on Wednesday, which will be followed by the outcome of a two-day FOMC meeting. Apart from this, the Advance US Q3 GDP report and the US Personal Consumption Expenditures (PCE) Price Index on Thursday will be scrutinized for cues about the Federal Reserve's (Fed) policy path. The outlook, in turn, will drive the US Dollar (USD) and provide some meaningful impetus to the AUD/USD pair.
In the meantime, bets that the US central bank will raise borrowing costs again by the year-end amid inflation risks stemming from volatile oil prices, along with persistent geopolitical uncertainties, might continue to act as a tailwind for the safe-haven Greenback. The downside for the AUD/USD pair, however, remains cushioned amid hawkish Reserve Bank of Australia (RBA) expectations, warranting some caution before confirming that spot prices have topped out.
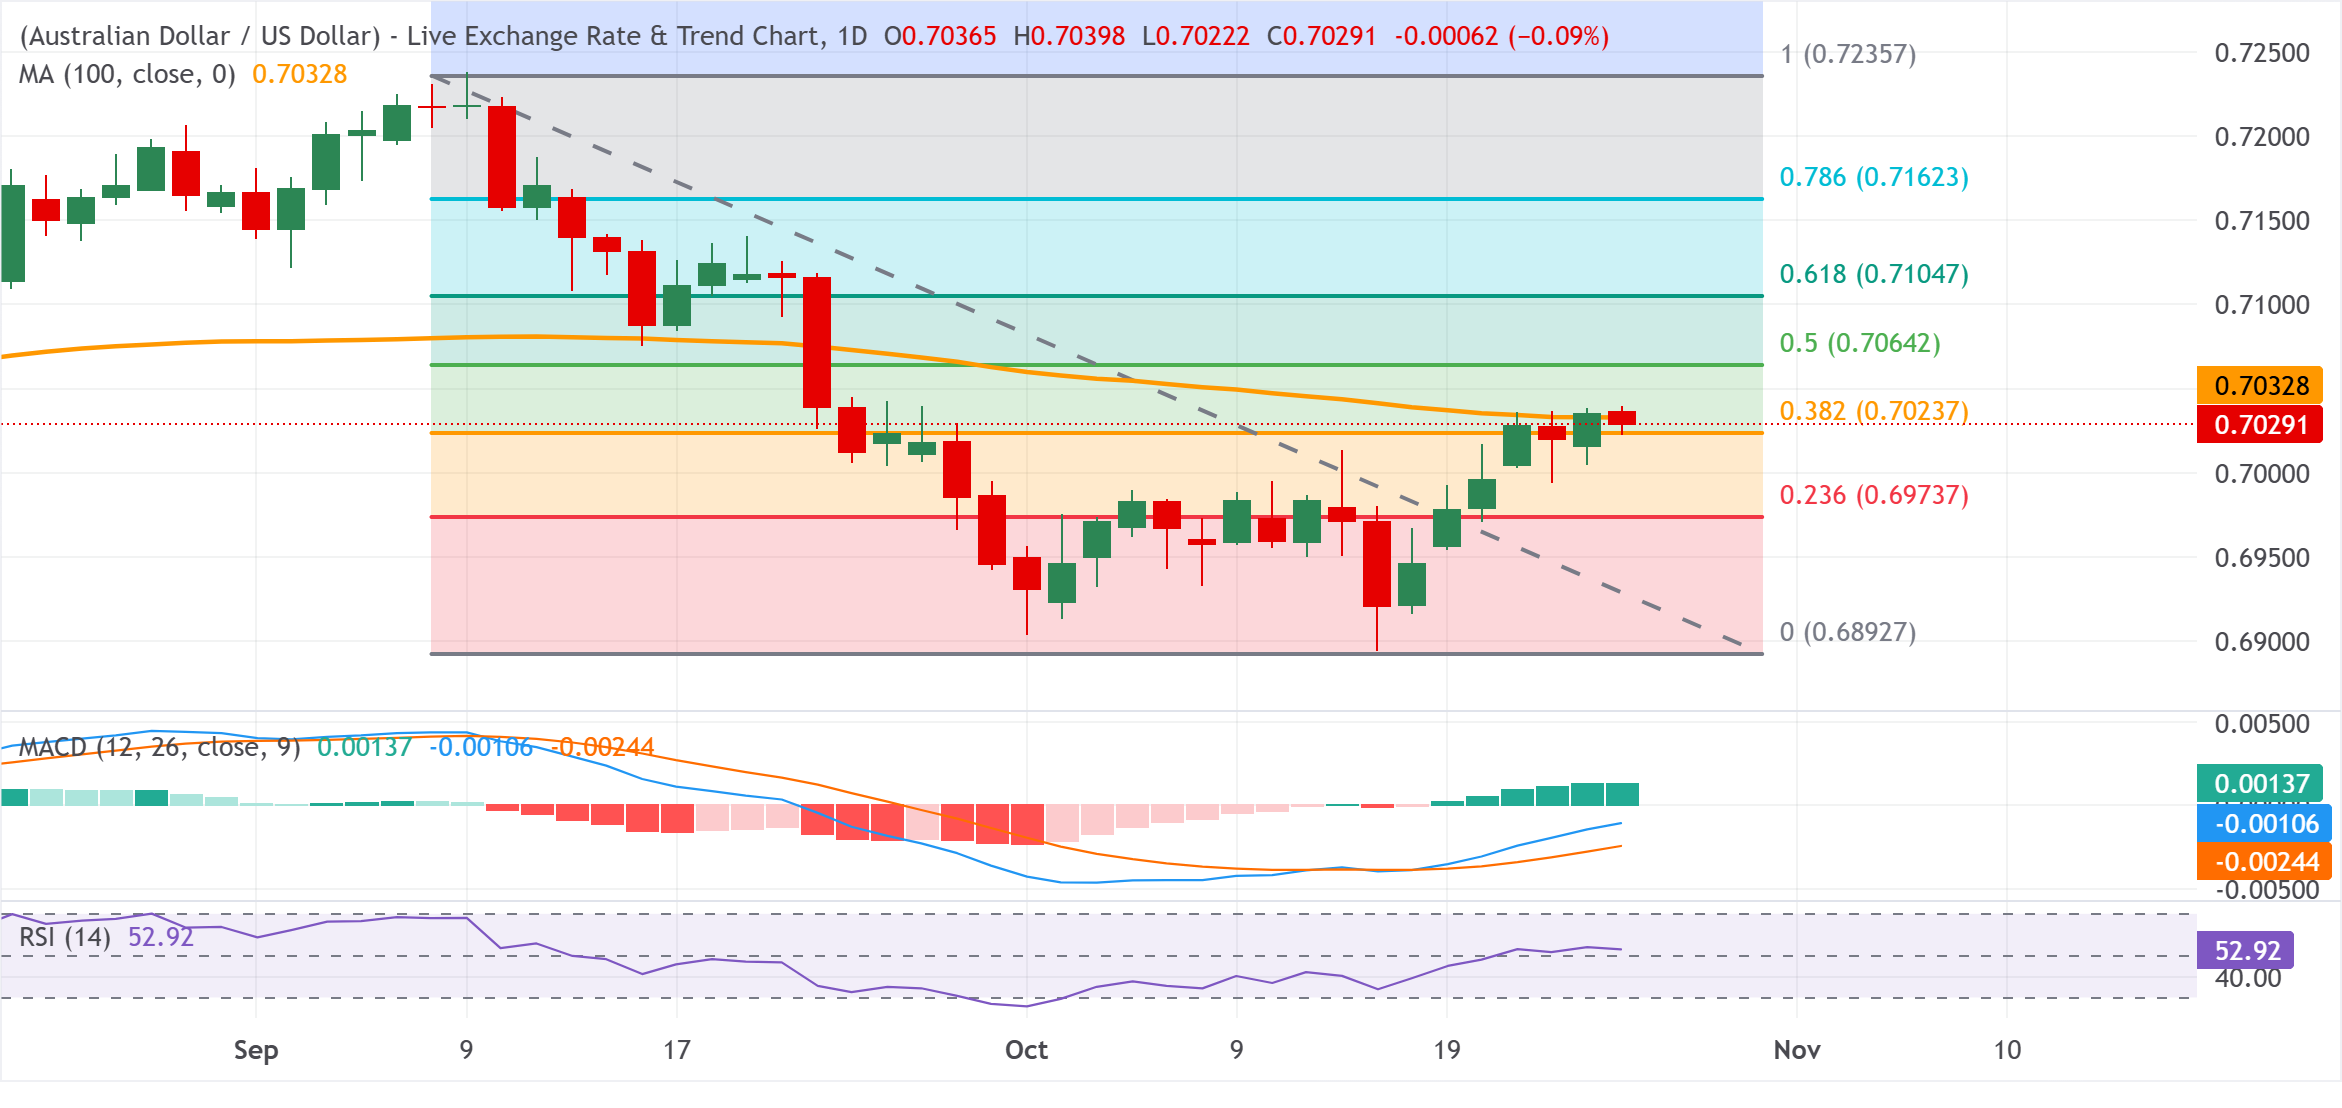
From a technical perspective, the AUD/USD pair keeps a capped tone under the 100-day SMA at 0.7033, though it manages to hold above the 38.2% Fibonacci retracement of the latest downswing. Furthermore, the Moving Average Convergence Divergence (MACD) has turned mildly positive, and the Relative Strength Index (RSI) at 52.9 has edged into the upper half of its range. Momentum indicators, in turn, hint at a tentative recovery that remains constrained by the overhead resistance.
Meanwhile, a break above the 100-day SMA at 0.7033 would expose the 50.0% retracement at 0.7064, with further resistance seen at the 61.8% level at 0.7105 and the 78.6% retracement at 0.7162, before the full recovery barrier at 0.7236 comes into view. On the downside, immediate support aligns with the 38.2% retracement at 0.7024, ahead of the 23.6% level at 0.6974 and the recent cycle floor near 0.6893.
(The technical analysis of this story was written with the help of an AI tool. Know more.)
AUD/USD daily chart
Economic Indicator
Consumer Price Index (YoY)
The Consumer Price Index (CPI), released by the Australian Bureau of Statistics on a monthly basis, measures the changes in the price of a comprehensive basket of goods and services acquired by household consumers. The indicator is the primary measure of headline inflation after a new methodology was applied to transition from quarterly to monthly readings, applying to data from April 2024 onwards. The YoY reading compares prices in the reference month to the same month a year earlier. A high reading is seen as bullish for the Australian Dollar (AUD), while a low reading is seen as bearish.
Read more.Next release: Wed Oct 28, 2026 00:30
Frequency: Monthly
Consensus: 4.2%
Previous: 4%
Source: Australian Bureau of Statistics
Related Articles