Noticias del mercado & perspectivas
Anticípate a los mercados con perspectivas de expertos, noticias y análisis técnico para guiar tus decisiones de trading.

El anuncio del alto el fuego del 8 de abril y las discusiones paralelas en torno a una tregua de 45 días no han resuelto la interrupción del Estrecho de Ormuz. Por ahora, han puesto un tope al peor escenario posible, pero el tráfico de petroleros se mantiene en una fracción de los niveles normales y la demanda iraní de tarifas de tránsito señala un cambio estructural, no temporal.
Lo que comenzó como un conflicto regional se ha convertido en un shock energético global, y la pregunta para los mercados ya no es si Ormuz fue interrumpido, sino cómo permanentemente la interrupción cambia el piso de precios para el petróleo.
Puntos clave
- Alrededor de 20 millones de barriles por día (bpd) de petróleo y productos derivados del petróleo normalmente pasan por el Estrecho de Ormuz entre Irán y Omán, lo que equivale a aproximadamente una quinta parte del consumo mundial de petróleo y aproximadamente el 30% del comercio mundial de petróleo marítimo.
- Esto es un choque de flujo, no un problema de inventario. Los mercados petroleros dependen del rendimiento continuo, no del almacenamiento de información estático.
- Si la interrupción persiste más allá de unas pocas semanas, el Brent podría pasar de un pico a corto plazo a un shock de precios más amplio, con riesgo de estanflación.
- El tráfico de petroleros a través del estrecho cayó de alrededor de 135 barcos por día a menos de 15 en el pico de interrupción, una reducción de aproximadamente 85%, con más de 150 embarcaciones ancladas, desviadas o retrasadas.
- El 8 de abril se anunció un alto el fuego de dos semanas, con negociaciones de tregua de 45 días en curso. Irán ha señalado por separado una demanda de tarifas de tránsito para los buques que utilizan el estrecho, lo que, de formalizar, representaría un piso geopolítico permanente en los costos de energía.
- Los mercados han comenzado a alejarse del crecimiento y la exposición tecnológica hacia los nombres de energía y defensa, lo que refleja la opinión de que el petróleo elevado se está convirtiendo en un costo estructural en lugar de una prima de riesgo temporal.
El punto de choque petrolero más crítico del mundo
El Estrecho de Ormuz maneja aproximadamente 20 millones de barriles diarios de petróleo y productos derivados del petróleo, lo que equivale a alrededor del 20% del consumo mundial de petróleo y alrededor del 30% del comercio mundial de petróleo marítimo. Con la demanda mundial de petróleo cercana a los 104 millones de bpd y la capacidad sobrante limitada, el mercado ya estaba fuertemente equilibrado antes de la última escalada.
El estrecho también es un corredor crítico para el gas natural licuado. Alrededor de 290 millones de metros cúbicos de GNL transitaron por la ruta cada día en promedio en 2024, lo que representa aproximadamente el 20% del comercio mundial de GNL, siendo los mercados asiáticos el principal destino.
La Agencia Internacional de Energía (AIE) ha descrito a Ormuz como el punto de choque del tránsito petrolero más importante del mundo, señalando que incluso las interrupciones parciales pueden desencadenar movimientos desmedidos de precios. El crudo Brent se ha movido por encima de los 100 dólares el barril, lo que refleja tanto la estanqueidad física como una prima de riesgo geopolítico al alza.

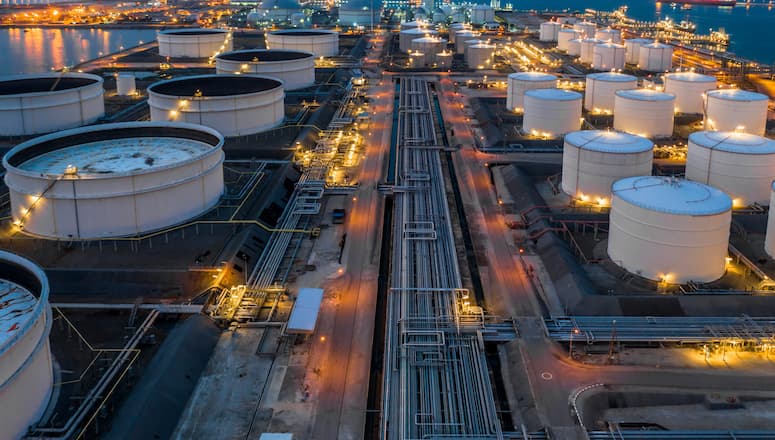
Tanques inactivos a medida que los flujos son lentos
Los datos de envío y seguros ahora apuntan a tensión en tiempo real. Se informa que más de 85 grandes transportistas de crudo están varados en el Golfo Pérsico, mientras que más de 150 embarcaciones han sido ancladas, desviadas o retrasadas a medida que los operadores reevalúan la cobertura de seguridad y seguros. Eso dejaría un estimado de 120 millones a 150 millones de barriles de crudo inactivos en el mar.
Esos volúmenes representan solo de seis a siete días de rendimiento normal de Hormuz, o un poco más de un día de consumo mundial de petróleo.
Los datos actualizados de envío y seguros confirman ahora que más de 150 embarcaciones han sido ancladas, desviadas o retrasadas, por encima de las 85 reportadas inicialmente. Los 1.3 días de cobertura de consumo mundial del crudo inactivo siguen siendo la limitación vinculante: se trata de un shock de flujo, no un problema de almacenamiento, y el alto el fuego aún no se ha traducido en un rendimiento restaurado de manera significativa.
Un mercado basado en el flujo, no en el almacenamiento de información
Los mercados petroleros funcionan en movimiento continuo. Las refinerías, las plantas petroquímicas y las cadenas de suministro mundiales están calibradas para lograr entregas estables a lo largo de rutas marítimas predecibles. Cuando los flujos a través de un punto de choque que lleva aproximadamente una quinta parte del consumo mundial de petróleo y alrededor del 30% del comercio mundial de petróleo marítimo se interrumpen, el sistema puede pasar del equilibrio al déficit en cuestión de días.
La capacidad de producción sobrante, concentrada en gran medida dentro de la OPEP, se estima en sólo 3 millones a 5 millones de bpd. Eso queda muy por debajo de los volúmenes en riesgo si los flujos de Ormuz se ven gravemente perturbados.
Oil market analysis
How long do idle tankers last?
135M idle barrels — days of cover against each demand benchmark

vs. Strait of Hormuz daily flow (20M bbl/day)
vs. Global oil consumption (104M bbl/day)
vs. US Strategic Petroleum Reserve release (1M bbl/day)
135M
idle barrels on tankers (midpoint of 120–150M range)
~33%
of daily Hormuz flow that is idle storage, not transit
<31 hrs
is all idle storage against global daily consumption
Riesgos de inflación y macroderrames
El impacto inflacionario de un choque petrolero suele llegar en oleadas. Los precios más altos del combustible y la energía pueden elevar rápidamente la inflación general a medida que los costos de gasolina, diésel y energía se muevan al alza.
Con el tiempo, los mayores costos de energía pueden pasar por fletes, alimentos, manufactura y servicios. Si la perturbación persiste, la combinación de una inflación elevada y un crecimiento más lento podría elevar el riesgo de un entorno estanflacionario y dejar a los bancos centrales enfrentando una difícil compensación.
Sin compensación fácil, un sistema con poca holgura
Lo que hace que el episodio actual sea particularmente agudo es la falta de holgura en el sistema global.
La oferta y la demanda mundiales cerca de 103 millones a 104 millones de bpd dejan poco colchón de sobra cuando un punto de choque que maneja casi 20 millones de bpd, o cerca de una quinta parte del consumo mundial de petróleo, se ve comprometido. La capacidad sobrante estimada de 3 millones a 5 millones de bpd, en su mayoría dentro de la OPEP, cubriría sólo una fracción de los volúmenes en riesgo.
Las rutas alternativas, incluidas las tuberías que eluden Ormuz y el envío reencaminado, solo pueden compensar parcialmente los flujos perdidos, y generalmente a un costo más alto y con plazos de entrega más largos.
Conclusión
Hasta que se restablezca el tránsito por el Estrecho de Ormuz y se vea como creíblemente seguro, es probable que los flujos mundiales de petróleo sigan deteriorados y las primas de riesgo sean elevadas. Para los inversionistas, los formuladores de políticas y los tomadores de decisiones corporativas, la pregunta central es si el petróleo puede moverse hacia donde necesita ir, todos los días, sin interrupción.


Tesla Inc. (NASDAQ: TSLA) reported Q4 2022 financial results after the market close in the US on Wednesday. World’s largest automaker reported revenue that fell short of Wall Street expectations at $24.32 billion (up by 37% vs. Q4 2021) vs. $24.669 billion expected.
The company beat earnings per share (EPS) estimates for Q4. EPS at $1.19 per share vs. $1.127 per share estimate. Company commentary ''Q4-2022 was another record-breaking quarter and 2022 was another record- breaking year.
In the last quarter, we achieved the highest-ever quarterly revenue, operating income and net income in our history. In 2022, total revenue grew 51% YoY to $81.5B and net income (GAP) more than doubled YoY to $12.6B.'' ''As we progress into 2023, we know that there are questions about the near- term impact of an uncertain macroeconomic environment, and in particular, with rising interest rates. The Tesla team is used to challenges, given the culture required to get the company to where it is today.
In the near term we are accelerating our cost reduction roadmap and driving towards higher production rates, while staying focused on executing against the next phase of our roadmap.'' Stock reaction The share price of Tesla was up by 0.38% at $144.34 a share at market close on Wednesday. The stock rose by around 1% in the after-hours trading after the results. Stock performance 1 month: +28.14% 3 months: -35.71% Year-to-date: +17.25% 1 year: -53.78% Tesla stock price targets High: $436 Median$194 Low: $85 Average: $208.55 Tesla is the 13 th largest company in the world with a market cap of $455.91 billion.
Tesla’s total market cap has decreased by 52% in the past year. You can trade Tesla Inc. (NASDAQ: TSLA) and many other stocks from the NYSE, NASDAQ, HKEX, ASX, LSE and DE with GO Markets as a Share CFD. Sources: Tesla Inc., TradingView, MarketWatch, MetaTrader 5, WSJ, CompaniesMarketCap

Mastercard Inc. (NYSE: MA) announced the latest financial results for the previous quarter before the market open on Thursday. World’s third largest financial services company beat both revenue and earnings per share (EPS) estimates for Q4 2022. The company reported revenue of $5.817 billion vs. $5.793 billion estimate.
EPS at $2.65 per share in Q4 vs. $2.575 per share expected. CEO commentary ''We closed out the year with strong financial results and notable wins which will help us capitalize on the tremendous secular shift to digital payments,'' Michael Miebach, CEO of the company said in a press release. ''As we look at the broader economy, we see the continued recovery of cross-border travel, with volumes up 59% versus a year ago and we’re encouraged by Asia opening up further. While macroeconomic and geopolitical uncertainty persists, consumer spending has been remarkably resilient.
We are well prepared to adjust our investment profile quickly if needed,'' Miebach concluded. Stock reaction Share price of Mastercard dipped by around 2% on Thursday, trading at around $374 a share. Stock performance 1 month: +7.91% 3 months: +17.65% Year-to-date: +8.06% 1 year: +7.19% Mastercard stock price targets Baird: $410 Barclays: $427 Truist Securities: $450 Jefferies: $430 Keybanc: $425 UBS: $441 Wells Fargo: $405 Mizuho: $380 Morgan Stanley: $437 Mastercard is the 19 th largest company in the world with a market cap of $363.31 billion.
You can trade Mastercard Inc. (NYSE: MA) and many other stocks from the NYSE, NASDAQ, HKEX, ASX, LSE and DE with GO Markets as a Share CFD. Sources: Mastercard Inc., TradingView, MarketWatch, MetaTrader 5, Benzinga, CompaniesMarketCap

Microsoft Corporation (NASDAQ: MSFT) reported the latest financial results on Wall Street after the market close on Tuesday. Let’s take a closer look at the results. The US technology giant reported revenue of $52.747 billion for quarter ending on December 31, 2022 (up by 2% year-over-year), narrowly falling short of $52.987 billion revenue expected.
Earnings per share (EPS) reported at $2.32 per share (down 6% year-over-year) vs. $2.293 per share estimate. CEO and CFO commentary ''The next major wave of computing is being born, as the Microsoft Cloud turns the world’s most advanced AI models into a new computing platform,'' CEO of Microsoft, Satya Nadella looked into the future of the company. ''We are committed to helping our customers use our platforms and tools to do more with less today and innovate for the future in the new era of AI,'' Nadella concluded. Amy Hood, CFO: ''We are focused on operational excellence as we continue to invest to drive growth.
Microsoft Cloud revenue was $27.1 billion, up 22% (up 29% in constant currency) year-over-year as our commercial offerings continue to drive value for our customers.'' Stock reaction Shares of Microsoft were down by 0.22% at market close on Tuesday, trading at $241.56 a share. The stock was up by around 4% in the after-hours. Stock performance 1 month: +2.14% 3 months: -3.44% Year-to-date: +0.93% 1 year: -16.10% Microsoft stock price targets High: $365.00 Median: $280.00 Low: $212.00 Average: $284.76 Microsoft is the 3 rd largest company in the world with a market cap of $1.804 trillion.
You can trade Microsoft Corporation (NASDAQ: MSFT) and many other stocks from the NYSE, NASDAQ, HKEX, ASX, LSE and DE with GO Markets as a Share CFD. Sources: Microsoft Corporation, TradingView, MarketWatch, MetaTrader 5, WSJ, CompaniesMarketCap
Ethereum and its big brother Bitcoin, have seen one of their most momentous moves since their peaks in November 2021. Various sector wide catalysts worked to move the price down including the collapse of Celsius and FTX which caused shockwaves to the cryptocurrency community. Inflationary pressures also left growth assets reeling in losses, leaving Ethereum beaten down over the last 12 months.
However, there are some signs that it might be starting to turn. From a broader economic perspective there is hope that the Federal Reserve will pivot from its aggressive rate hiking policy to avoid a potential recession which has led to a recent revival of growth assets including cryptocurrency. From a technical perspective the weekly price chart shows a clear head and shoulders pattern that has played out.
The question is whether sell down has finished or if there is further misery to come. The price has seen its range become tighter as it has struggled to break below the key support at $1050. This area also acts as the 200-week moving average adding to its supply.
The volume and volatility have also been reducing as the price has approached this level. The RSI is showing an interesting signal. The RSI has begun trending up which is diverging with the actual price action.
This may indicate that the price is ready to move to the upside in the short term. The 50-week moving average is plateauing indicating that the price is facing some strong support. On the daily chart, the price looks to be coiling with both the 50 day and 200 day moving averages trending up for the first time since before the price peaked in 2021.
Furthermore, it is possible that the 50-day moving average will cross through the 200-day moving average which is very bullish move. The price has also broken above both daily moving averages and may be looking to test the next resistance at $2030. This is also roughly the same price of the neckline of the underlying head and shoulders pattern.
Therefore, a target of $2030 is a reasonable for a short-term long trade/ Ultimately, the price of Ethereum looks like it may be ready to reverse however, it is still at the mercy of the broader Cryptocurrency sector news and macroeconomic catalysts.
The price of Natural Gas has continued its drive back down after peaking in the middle of last year. The price has had an aggressive sell off after an equally aggressive run during the initial stages of the Russian and Ukraine conflict. This was due to Russian gas exports being banned and elevated inflation levels.
However, as the conflict has subsided the price of gas has returned to its seasonal trends. In addition, in recent weeks warmer weather has reduced the reliance on the energy source for much of Europe. The chart from a technical perspective is exceptionally bearish.
For the better part of a decade the price was ranging between 1.5 – 6.5. The aggressive move in 2022 as discussed was due to the beginning of the Russia and Ukraine crisis. The price since then looks to have made a head and shoulders pattern which is a bearish reversal pattern.
The neckline was at 5.5 and was broken through. The price has also broken down through the 200-day EMA on fairly aggressive volume. By zooming out, it can be seen that the recent sell off has been the price moving back into its long-term consistent range.
Therefore, the price should be nearing a bottom. As the price approaches 1.5/2 it may become a good opportunity for a long trade. An initial target at the top of the range of 6.6 could be a reasonable target for this medium-term swing trade.
The daily chart confirms this move and shows how the price has broken through the mid-level of support at 3.5. The daily chart also shows how the volume has been reducing significantly indicating some potential exhaustion in the short term and a spike in buying may be favorable for an upward thrust in price. Ultimately, the price of Gas could gain momentum if Europe’s winter brings about cooler weather or if China’s demand increases as it moves out of its Covid 19 restrictions increasing demand.
With volatility still high for the price of a natural gas caution should still be had when placing a trade.

The outlook for the Australian equities market is one of the best globally and is set up to cope with a potential recession. The Australian market showed itself to be robust in much of the volatility and downturn of last year being one of the more solid economies. This relative strength has carried so far into 2023 and has largely been due to the resource heavy nature of the ASX with most companies on the index being large resource and mining.
The XJO was also geographically protected from much of the geopolitical conflict in Europe that many European markets had to suffer through. The XJO is currently just 300 points off its all time high and with improving commodity prices it is well placed to weather a recessionary storm. A reopening of China may further support growth of the Australian market because growth in China may help various sectors such as travel, construction, manufacturing, and resources.
Lastly, as the Central banks across the world look at lowering interest rates it will only help growth economies such as Australia. Risk assets such as the Technology sector and growth economies should benefit as the cost of borrowing comes down. Although Banks will have to balance the need to lower rates with the need to tame inflation and the fight between which is a worse evil to fight will be much of the talking point of 2023.
Technical Analysis As stated above the XJO is currently just about 300 points below its all-time highs and is trending towards that target. Firstly, on the weekly chart the XJO has been able to maintain a tight range over the last 2 years. Once the dust had settled after the Covid 19 pandemic the price developed a range between 6412 and 7634.
The price also bounced of 6412 its long-term support twice in 2022 before pushing higher. Importantly, since October 2022, the XJO has been able to stay above the 50-week moving average as it has gained momentum. On the daily chart the price has broken to level not seen since April 2022.
Therefore, it is likely that the price may face some significant resistance as it approached 7600. Another positive sign is that the short term 50 day moving average has crossed back over the longer term 200 day moving average. This indicates that momentum is beginning to shift towards the bulls.
With more information still to come out, the Australian equities market is as well placed as any to deal with any potential macroeconomic factors that come its way.