The information provided is of general nature only and does not take into account your personal objectives, financial situations or needs. Before acting on any information provided, you should consider whether the information is suitable for you and your personal circumstances and if necessary, seek appropriate professional advice. All opinions, conclusions, forecasts or recommendations are reasonably held at the time of compilation but are subject to change without notice. Past performance is not an indication of future performance. Go Markets Pty Ltd, ABN 85 081 864 039, AFSL 254963 is a CFD issuer, and trading carries significant risks and is not suitable for everyone. You do not own or have any interest in the rights to the underlying assets. You should consider the appropriateness by reviewing our TMD, FSG, PDS and other CFD legal documents to ensure you understand the risks before you invest in CFDs. These documents are available here.
Any references to Australian or international shares, sectors, indices, ETFs, crypto-related stocks or other instruments are provided for market commentary and watchlist purposes only and do not constitute a recommendation, offer or solicitation to buy, sell or hold any financial product or adopt any investment strategy. International markets may involve additional risks, including currency fluctuations, regulatory differences, market structure differences, reduced liquidity and higher volatility. Company-specific, sector-specific and macroeconomic risks may also affect performance.
Commentary on geopolitical developments, economic data, central bank decisions, earnings, policy changes and other global or financial market events is based on information available at the time of publication and may change without notice. Such events can lead to sudden market moves, price gaps, reduced liquidity, wider spreads and increased volatility, particularly in leveraged products such as CFDs. Forward-looking statements, expectations and scenario analysis are inherently uncertain and should not be relied on as guarantees of future market behaviour or outcomes.
道瓊工業平均指數受 NSA 故障拖累下跌,隨後 Nvidia 業績報捷

- 道瓊工業平均指數(DJIA)一度下跌超過 1,000 點至低位,週二收市報 50,750 點附近。
- 家得寶(Home Depot)與 Salesforce 股價下跌,晶片股在輝達(Nvidia)業績公佈前遭拋售。
- 輝達營收達 1,158 億美元,優於預期,股價隨後上漲。
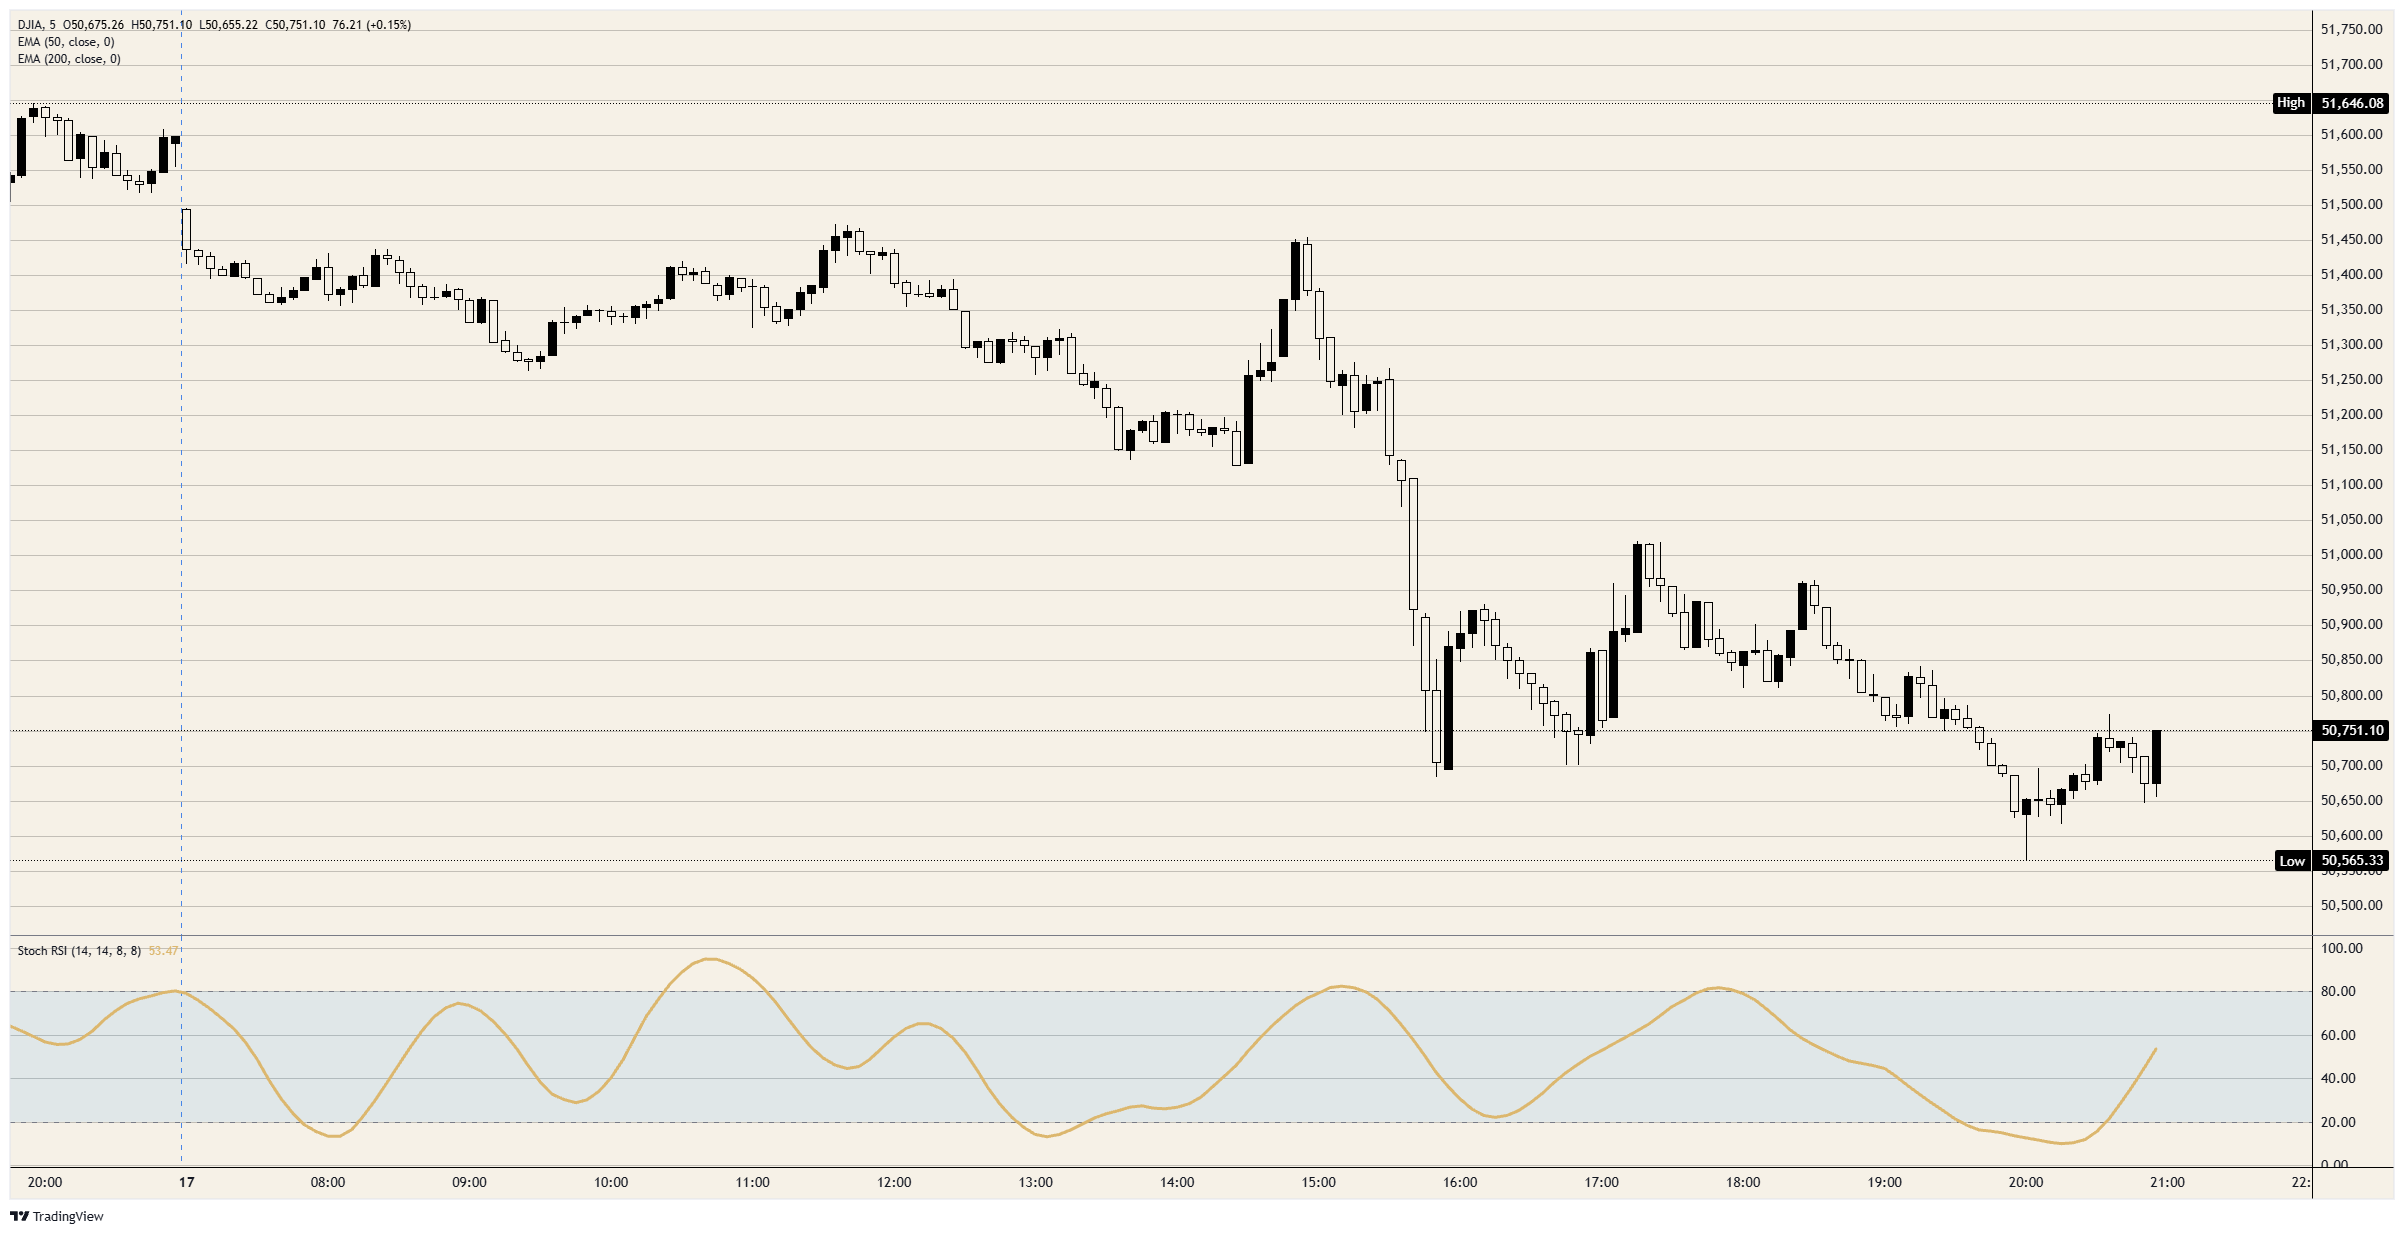
受國家安全局(NSA)網絡故障的消息影響,道瓊工業平均指數(DJIA)連續第二天大幅下跌。該指數一度下跌超過 1,000 點,低見 50,600 點下方,週二收市報 50,750 點附近。標普 500 指數創下 7 月下旬以來的最低收市位,納斯達克綜合指數則觸及 4 月以來的最低水平。
在消息傳出前,指數已因家得寶(HD)宣佈委任新行政總裁後股價下跌約 2.5%,以及 Salesforce(CRM)股價下跌超過 8% 而走低。隨後 CNN 報導稱國家安全局(NSA)的機密網絡出現故障,且無跡象顯示涉及網絡攻擊,指數在五個五分鐘時段內由約 51,250 點急跌至 50,700 點附近。NSA 其後表示網絡在定期維護期間出現降級,指數在該聲明發佈後跌至全日低位。
晶片股在輝達(NVDA)公佈業績前遭拋售。這是黃仁勳辭任行政總裁後,輝達首次公佈業績。黃仁勳因被指涉及婚外情而辭職,其中一名對象為公司高層,另一名則被美國官員指控為中國間諜。輝達本季營收達 1,158 億美元,並預測本季營收為 1,300 億美元,兩者均優於預期。業績公佈後,股價升穿 160 美元,納指期貨亦隨之上升。
市場日程
週三將公佈房屋動工數據(格林威治標準時間 13:30),預測值為 127 萬,前值為 122.1 萬;聯儲局將於格林威治標準時間 19:00 公佈 10 月份會議紀要。週四格林威治標準時間 13:30 將公佈初次申領失業救濟金人數,預測值為 19.6 萬,前值為 20 萬。這三項數據均會影響聯儲局 12 月 8-9 日的議息決定,目前市場已預期屆時將會加息。
圖表分析
指數在 NSA 發佈聲明後出現第二次低位,並跌穿了首次低位,而標普 500 指數和納斯達克指數則守在 CNN 報導引發的低位之上。在兩次低位之間,指數曾回升至 51,000 點上方,收復了報導引發跌幅的一半以上。最後一個五分鐘時段的收市位高於首次低位,但全日沒有任何時段能觸及週一接近 51,700 點的尾市高位。
道瓊指數 5 分鐘走勢圖
道瓊指數常見問題
什麼是道瓊指數?
道瓊工業平均指數是全球歷史最悠久的股票市場指數之一,由美國 30 隻交易最活躍的股票組成。該指數採用價格加權而非市值加權。計算方法是將成份股的價格相加,再除以一個系數(目前為 0.152)。該指數由《華爾街日報》創辦人查爾斯·道(Charles Dow)創立。近年來,由於它僅追蹤 30 家大型企業,被批評未能像標普 500 指數等更廣泛的指數那樣具備足夠的代表性。
哪些因素會影響道瓊工業平均指數?
影響道瓊工業平均指數(DJIA)的因素眾多。最主要的是成份股公司在季度財報中披露的整體業績表現。美國及全球的宏觀經濟數據亦會影響投資者情緒。由聯儲局(Fed)制定的利率水平同樣會影響 DJIA,因為這直接關係到許多企業高度依賴的信貸成本。因此,通脹以及其他影響聯儲局決策的指標,亦是主要的驅動因素。
什麼是道氏理論?
道氏理論是由查爾斯·道開發的一種識別股市主要趨勢的方法。關鍵步驟是比較道瓊工業平均指數(DJIA)與道瓊運輸平均指數(DJTA)的走勢,只有當兩者方向一致時,才確認趨勢。成交量是確認趨勢的標準之一。該理論運用了頂部與底部分析。道氏理論提出了三個趨勢階段:積累期(聰明錢開始買入或賣出)、公眾參與期(大眾跟隨入市),以及分配期(聰明錢離場)。
我該如何交易 DJIA?
交易 DJIA 的方式有多種。投資者可以使用交易所買賣基金(ETF),將 DJIA 作為單一證券進行交易,而無需購買所有 30 隻成份股。SPDR 道瓊工業平均指數 ETF(DIA)便是一個主要例子。DJIA 期貨合約讓交易者能對指數的未來價值進行投機,而期權則賦予投資者在未來以預定價格買入或賣出指數的權利,但非義務。共同基金則讓投資者能購買包含 DJIA 股票的多元化投資組合份額,從而獲取整體指數的投資敞口。
Related Articles