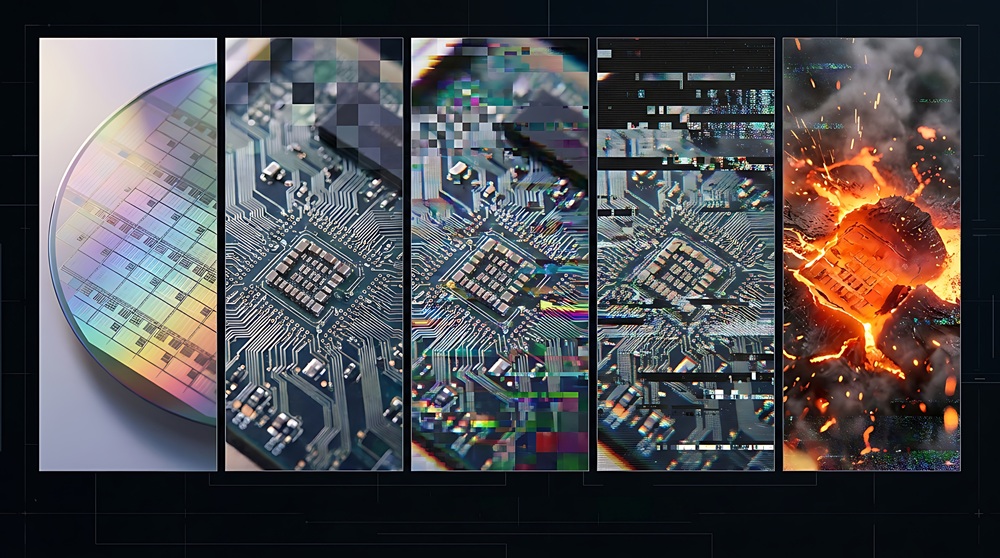
Analyse whether Asia's AI boom is a bubble or structural rally. These are the 3 stocks to watch.
Here is the thing about East Asian equity markets right now: we are looking at a classic split-screen economy. On one side, AI hardware providers are pulling in record revenues. On the other, traditional domestic sectors are navigating real economic cooling.
This divergence has created extreme market concentration across major regional exchanges:
Equity indices on the Taiwan Stock Exchange (TWSE) and the Korea Composite Stock Price Index (KOSPI) are heavily weighted towards just a handful of chipmakers. Taiwan Semiconductor Manufacturing Company (TSMC) represents a commanding weighting in Taiwan's benchmark TAIEX index, while the top two semiconductor leaders in South Korea account for a dominant share of the KOSPI.
When an entire national benchmark is driven by two or three mega-cap stocks, index neutrality completely vanishes. Evaluating whether current valuations appear stretched or remain supported by underlying operating performance comes down to weighing real operational cash flows against key structural vulnerabilities.
The bull case: High capacity utilisation
Unlike the speculative dot-com expansion of 1999, current Asian AI hardware valuations are anchored by physical operational metrics:
Advanced foundry nodes and specialized memory packaging facilities continue operating near full capacity. high-bandwidth memory (HBM) production from market leaders like SK Hynix remains committed under multi-year supply contracts.
Multi-billion-dollar capital expenditure (capex) commitments from global technology buyers provide hardware manufacturers with multi-year revenue visibility over extended investment horizons.
The vulnerability framework
Despite strong balance sheets, three main variables could trigger sharp repricing events across Asian technology shares:
What this means for execution
As macro pressures collide with concentrated equity benchmarks, traders must navigate three primary execution realities:
3 stocks to watch
Illustrative technical scenarios only. Not trade signals or financial advice.
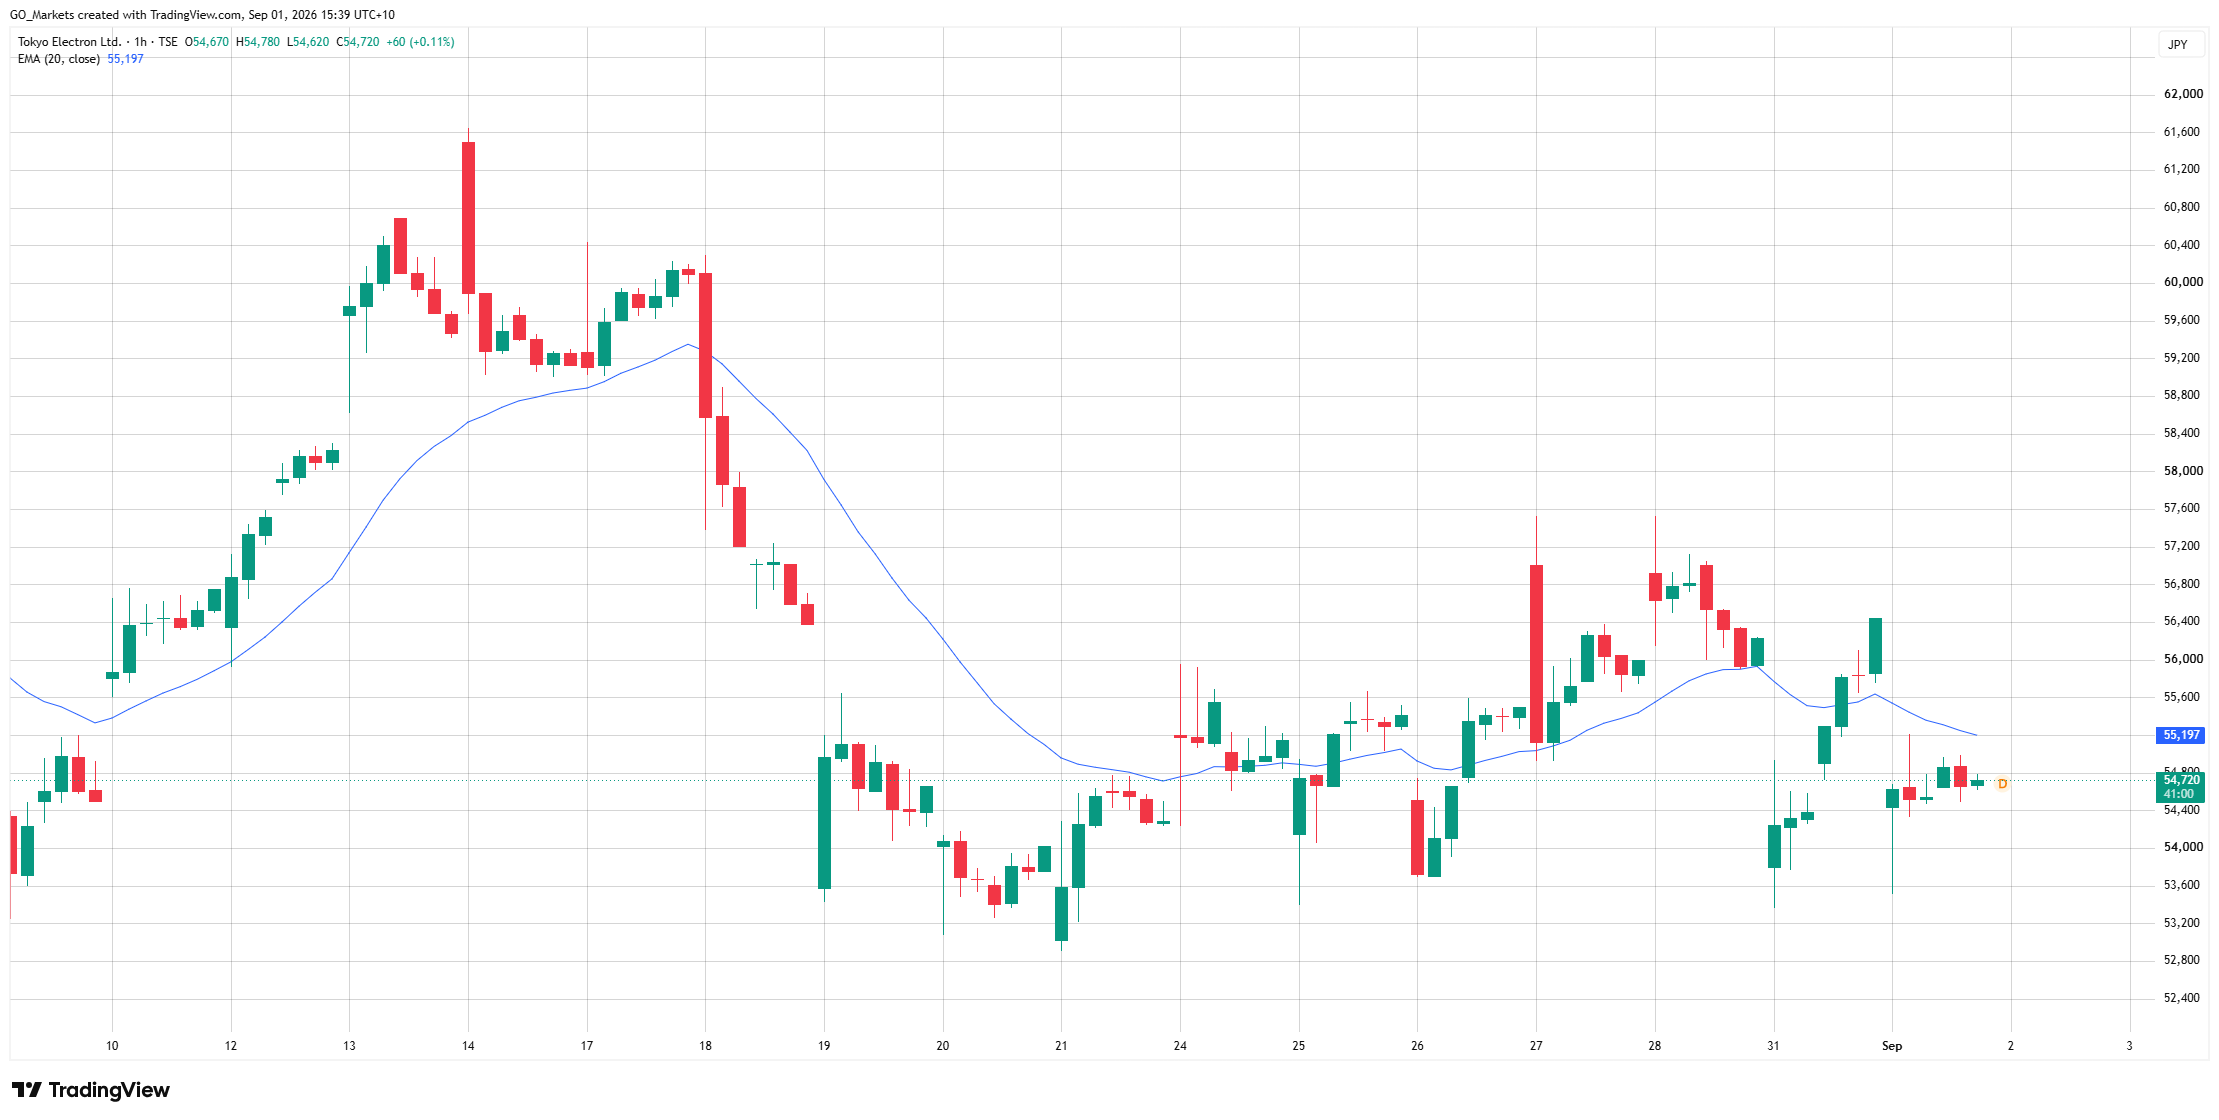
Tokyo Electron Ltd.
Technical observation: Constructive above the ¥53,500 pivot level. Tokyo Electron maintains a constructive technical structure on intraday timeframes following a bounce off key moving average support. Technical momentum remains intact above the ¥53,500 pivot level, with upper resistance zones observed near ¥56,500 and ¥58,000. Intraday price action remains sensitive to foreign exchange movements, specifically the US dollar against Japanese yen (USD/JPY) currency pair trading near 159.80 in late August 2026.
Source: TradingView. Market data as at 1 September 2026.
If the currency pair clears the 160.20 resistance level, driven by a hawkish Federal Reserve stance and a passive Bank of Japan, potential revenue expansion through export margin inflation could push technical momentum to favour observation above ¥56,500 towards ¥59,100.
If FX rates consolidate between 158.50 and 159.80 while markets await upcoming US employment and consumer price index (CPI) data releases, price action is expected to remain range-bound between ¥53,500 and ¥56,500.
Should official Ministry of Finance (MOF) intervention or rate signals pull USD/JPY below 157.00, heightened volatility could test support near the ¥53,500 pivot towards ¥50,500.
A sustained decline below 155.00 driven by lower US yields would trigger a broader structural valuation adjustment, shifting technical bias towards lower support testing.
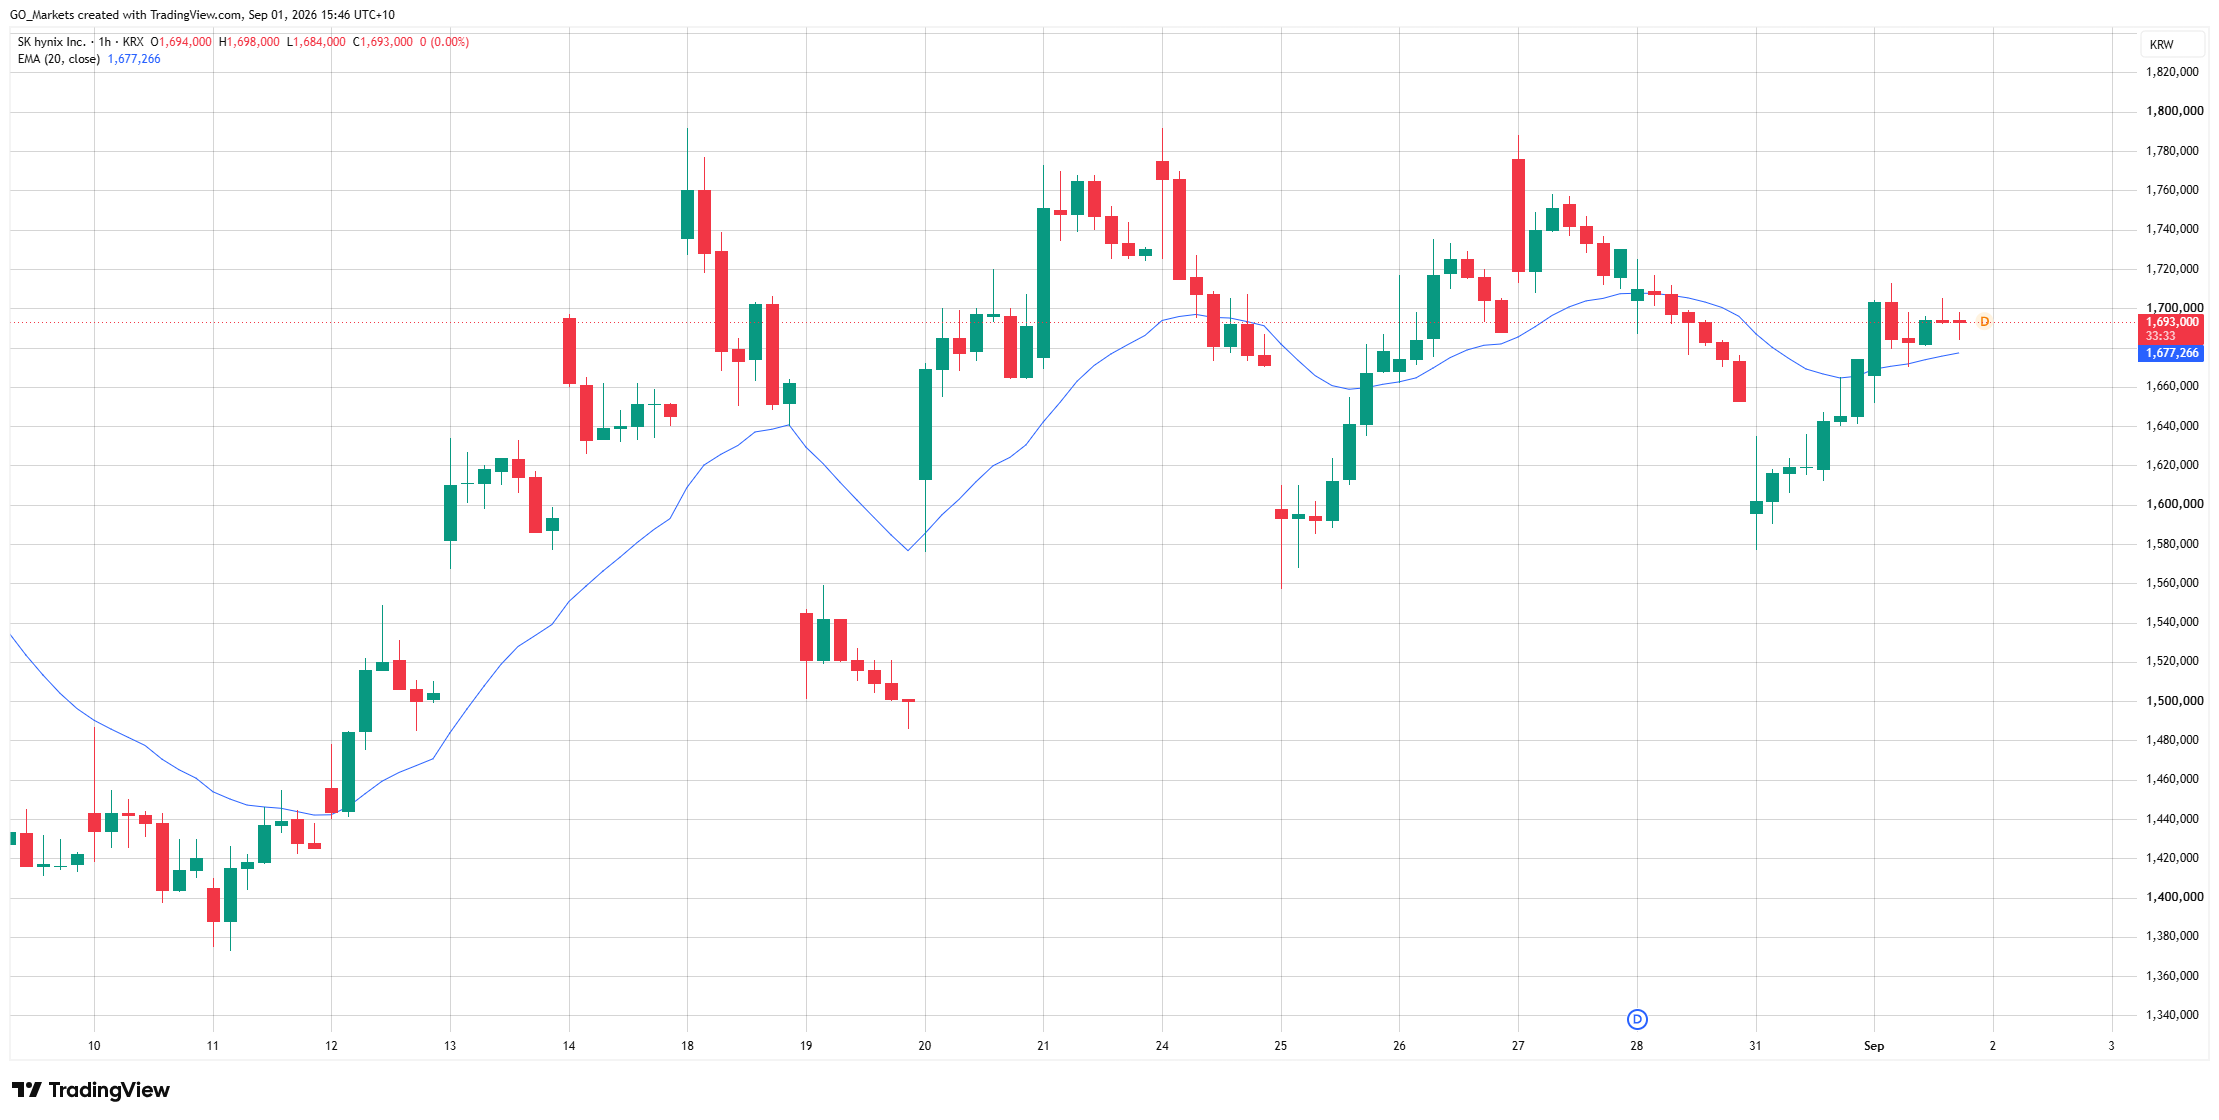
SK Hynix Inc.
Technical observation: Constructive above the ₩1,650,000 pivot level. SK Hynix displays a constructive technical pattern on intraday timeframes following a bounce off key support. Technical momentum remains intact above the ₩1,650,000 pivot level, with upper resistance zones observed near ₩1,720,000 and ₩1,780,000. Given SK Hynix's role in HBM production, intraday sentiment remains correlated with US technology hardware moves and US dollar against South Korean won (USD/KRW) exchange rate stability.
Source: TradingView. Market data as at 1 September 2026.
If NVDA gains more than 3% in the US session, reflecting expanded cloud AI infrastructure allocations, correlated upside momentum and morning gap risk could prompt price action to test upper reference zones above ₩1,650,000.
If US technology consolidates ahead of CPI or Fed announcements, SK Hynix is expected to remain neutral and range-bound between ₩1,580,000 and ₩1,720,000.
Alternatively, a pullback in US hardware driven by supply chain concerns or capex moderation could test technical support near the ₩1,650,000 pivot down towards ₩1,520,000.
Should USD/KRW spike sharply from broad risk-off capital flows into US dollar cash positions, emerging market currency drag could pressure KOSPI technology shares.
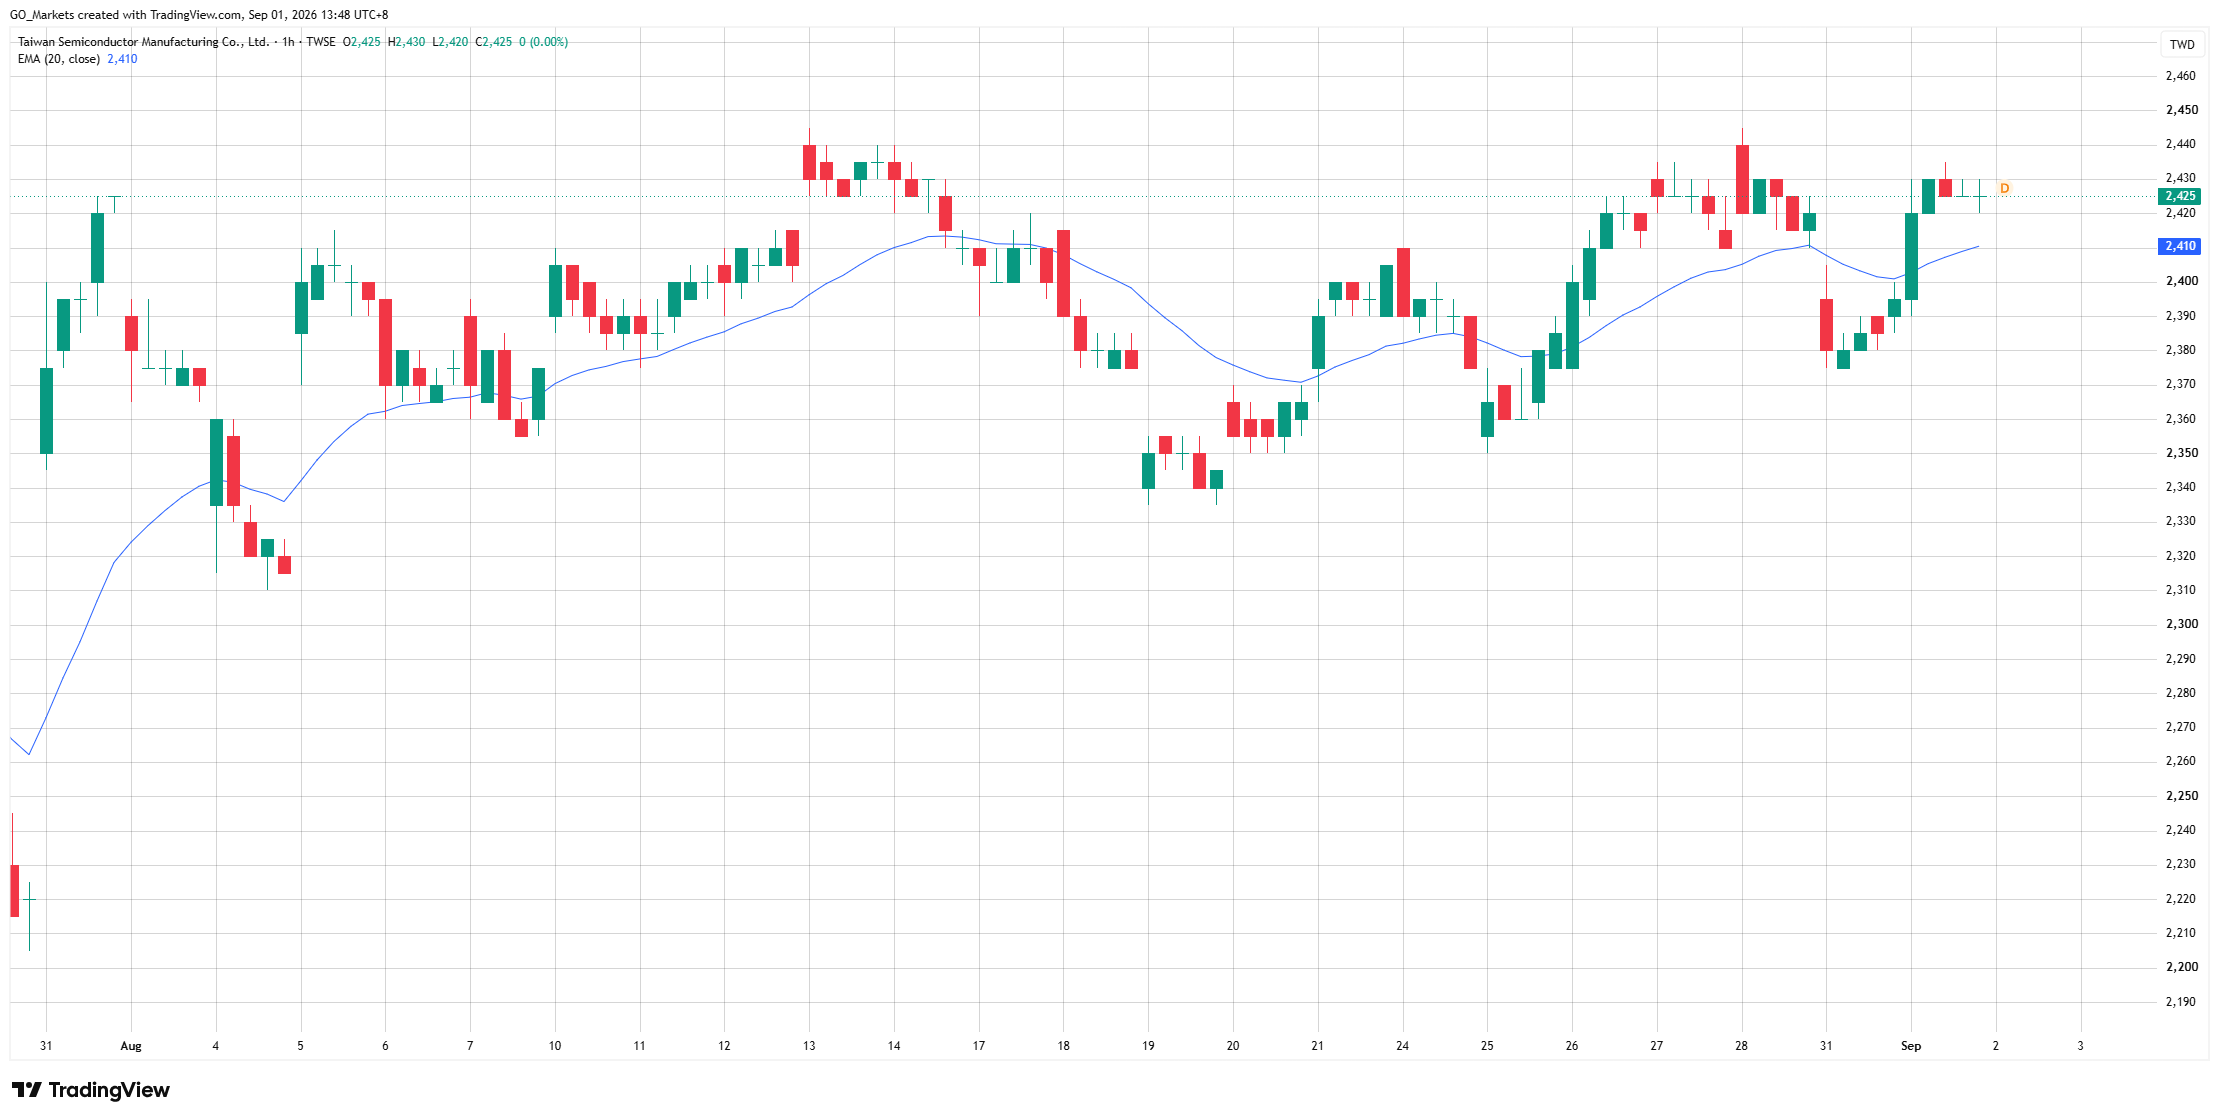
Taiwan Semiconductor Manufacturing Co.
Technical observation: Bullish bias intact above the NT$2,400 pivot level. TSMC maintains an upward technical pattern on intraday timeframes, hovering near the NT$2,400 psychological pivot level. Given TSMC's role as a major foundry for global semiconductor designers amid the ongoing AI chip war, price action remains sensitive to overnight US market moves and trade policy headlines, which can induce gap risk on the market open.
Source: TradingView. Market data as at 1 September 2026.
If the US Philadelphia Semiconductor Index (SOX) surges more than 2% on broad risk-on sentiment for semiconductor manufacturing, positive correlation momentum may observe breakouts above NT$2,450 towards NT$2,500.
Should international trade or tariff concerns escalate, opening price action may test support levels near NT$2,360 or NT$2,320 before stabilising.
A controlled weakening in the Taiwan dollar acts as an export margin tailwind, with pullbacks towards the NT$2,400 pivot level representing an area where technical buying interest may be observed.
Conversely, if major clients revise node allocations downward amid concerns over the AI capex spending vs revenue balance, technical support below NT$2,360 will come into focus.

The information provided is of general nature only and does not take into account your personal objectives, financial situations or needs. Before acting on any information provided, you should consider whether the information is suitable for you and your personal circumstances and if necessary, seek appropriate professional advice. All opinions, conclusions, forecasts or recommendations are reasonably held at the time of compilation but are subject to change without notice. Past performance is not an indication of future performance. Go Markets Pty Ltd, ABN 85 081 864 039, AFSL 254963 is a CFD issuer, and trading carries significant risks and is not suitable for everyone. You do not own or have any interest in the rights to the underlying assets. You should consider the appropriateness by reviewing our TMD, FSG, PDS and other CFD legal documents to ensure you understand the risks before you invest in CFDs. These documents are available here.
Any references to Australian or international shares, sectors, indices, ETFs, crypto-related stocks or other instruments are provided for market commentary and watchlist purposes only and do not constitute a recommendation, offer or solicitation to buy, sell or hold any financial product or adopt any investment strategy. International markets may involve additional risks, including currency fluctuations, regulatory differences, market structure differences, reduced liquidity and higher volatility. Company-specific, sector-specific and macroeconomic risks may also affect performance.
Commentary on geopolitical developments, economic data, central bank decisions, earnings, policy changes and other global or financial market events is based on information available at the time of publication and may change without notice. Such events can lead to sudden market moves, price gaps, reduced liquidity, wider spreads and increased volatility, particularly in leveraged products such as CFDs. Forward-looking statements, expectations and scenario analysis are inherently uncertain and should not be relied on as guarantees of future market behaviour or outcomes.