
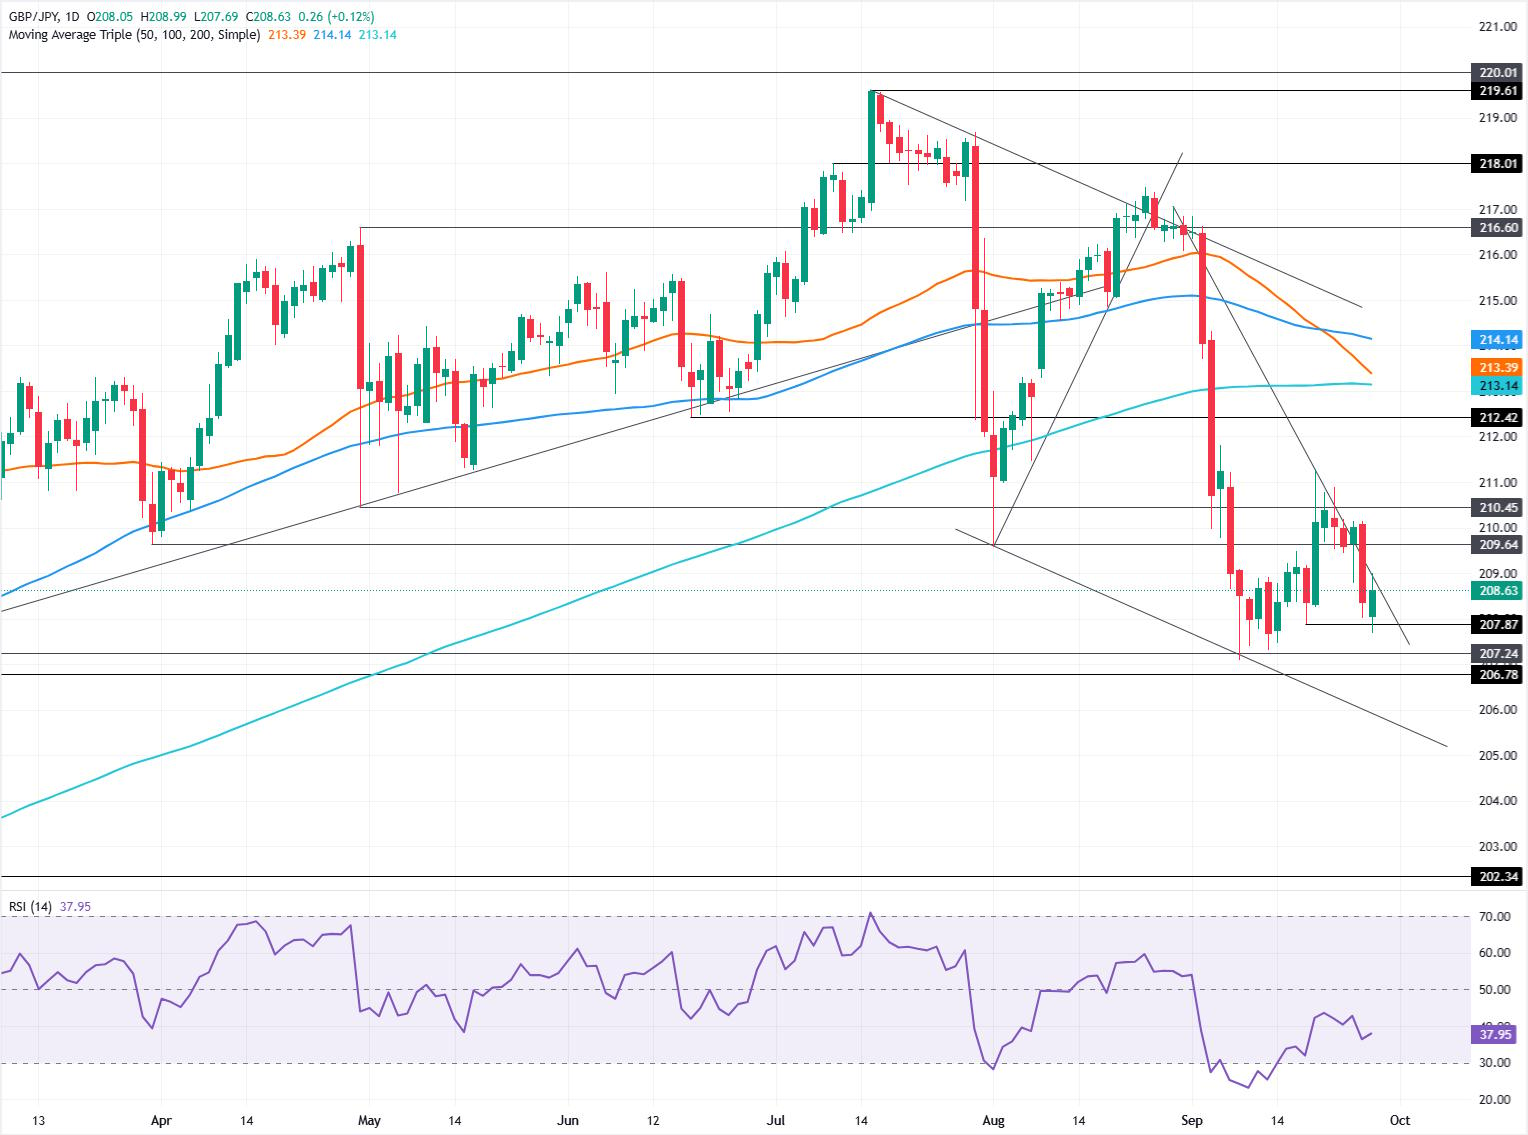
- GBP/JPY rebounds from 207.60 but stalls beneath 209.00 trendline resistance.
- Flat RSI signals neither buyers nor sellers hold momentum advantage.
- Break above 209.00 exposes 210.15, 211.00 and 211.28 next.
The Pound-Yen cross-pair finds support near 207.60 and bounces towards a daily high of 208.99 before settling at around 208.66, gaining 0.14%.
GBP/JPY Price Forecast: Technical Outlook
The GBP/JPY price action shows the pair trading near the mid-point of the 207.50-211.00 range, with the cross unable to clear a key resistance trendline near 209.00.
Momentum, although bearish as depicted in the Relative Strength Index (RSI), turned flat. This suggests that further consolidation lies ahead.
If GBP/JPY climbs above 209.00, this exposes the September 24 high of 210.15, before bulls set their sights on 211.00. Once surpassed, the next stop is the September 18 high at 211.28, followed by 212.00.
On the downside, if GBP/JPY tumbles below 208.00, it exposes the September 17 low of 207.87, followed by the 207.50 psychological level. Below the next support is the September 8 low of the day (LOD) of 207.10, ahead of 207.00.
GBP/JPY Price Chart – Daily
Japanese Yen Price This week
The table below shows the percentage change of Japanese Yen (JPY) against listed major currencies this week. Japanese Yen was the strongest against the Australian Dollar.
| USD | EUR | GBP | JPY | CAD | AUD | NZD | CHF | |
|---|---|---|---|---|---|---|---|---|
| USD | -0.02% | 0.02% | 0.02% | 0.02% | 0.03% | -0.08% | 0.03% | |
| EUR | 0.02% | 0.06% | 0.00% | 0.05% | 0.03% | 0.08% | 0.05% | |
| GBP | -0.02% | -0.06% | 0.00% | -0.02% | 0.02% | 0.02% | 0.02% | |
| JPY | -0.02% | 0.00% | 0.00% | 0.01% | 0.02% | -0.04% | 0.01% | |
| CAD | -0.02% | -0.05% | 0.02% | -0.01% | 0.03% | -0.04% | -0.07% | |
| AUD | -0.03% | -0.03% | -0.02% | -0.02% | -0.03% | 0.02% | 0.00% | |
| NZD | 0.08% | -0.08% | -0.02% | 0.04% | 0.04% | -0.02% | -0.07% | |
| CHF | -0.03% | -0.05% | -0.02% | -0.01% | 0.07% | 0.00% | 0.07% |
The heat map shows percentage changes of major currencies against each other. The base currency is picked from the left column, while the quote currency is picked from the top row. For example, if you pick the Japanese Yen from the left column and move along the horizontal line to the US Dollar, the percentage change displayed in the box will represent JPY (base)/USD (quote).