The information provided is of general nature only and does not take into account your personal objectives, financial situations or needs. Before acting on any information provided, you should consider whether the information is suitable for you and your personal circumstances and if necessary, seek appropriate professional advice. All opinions, conclusions, forecasts or recommendations are reasonably held at the time of compilation but are subject to change without notice. Past performance is not an indication of future performance. Go Markets Pty Ltd, ABN 85 081 864 039, AFSL 254963 is a CFD issuer, and trading carries significant risks and is not suitable for everyone. You do not own or have any interest in the rights to the underlying assets. You should consider the appropriateness by reviewing our TMD, FSG, PDS and other CFD legal documents to ensure you understand the risks before you invest in CFDs. These documents are available here.
Any references to Australian or international shares, sectors, indices, ETFs, crypto-related stocks or other instruments are provided for market commentary and watchlist purposes only and do not constitute a recommendation, offer or solicitation to buy, sell or hold any financial product or adopt any investment strategy. International markets may involve additional risks, including currency fluctuations, regulatory differences, market structure differences, reduced liquidity and higher volatility. Company-specific, sector-specific and macroeconomic risks may also affect performance.
Commentary on geopolitical developments, economic data, central bank decisions, earnings, policy changes and other global or financial market events is based on information available at the time of publication and may change without notice. Such events can lead to sudden market moves, price gaps, reduced liquidity, wider spreads and increased volatility, particularly in leveraged products such as CFDs. Forward-looking statements, expectations and scenario analysis are inherently uncertain and should not be relied on as guarantees of future market behaviour or outcomes.
Gold edges higher as US midterm election results trigger sudden USD fall

- Gold attracts some buyers on Wednesday as the early US election results weigh heavily on the USD.
- Sliding US bond yields further exert pressure on the buck, though geopolitical risks help limit losses.
- Fed rate hike bets contribute to capping gains for the bullion as traders await key US macro releases.
Gold (XAU/USD) gains some positive traction during the Asian session on Wednesday as early US midterm election results heighten political uncertainty and weigh heavily on the US Dollar (USD). In fact, early trends show the possibility of Democrats securing control of both the House of Representatives and the Senate. This raises the prospect of gridlock in Washington and limits government spending. Moreover, a Democratic sweep could be potentially negative for tech stocks and economic growth, boosting demand for safe-haven assets and triggering a fresh leg down in US bond yields. This turns out to be another factor that contributes to the USD's intraday slump to its lowest level since late September.
However, hawkish US Federal Reserve (Fed) expectations fail to assist gold in building on the modest intraday uptick. According to the CME Group's FedWatch Tool, traders are currently assigning a nearly 80% chance that the US central bank will raise borrowing costs again at the next policy meeting in December. The bets were lifted by the Labor Department's Job Openings and Labor Turnover Survey, or the JOLTS report, on Tuesday, which showed that hiring held relatively steady in September. In fact, job openings rose to 7.523 million during the reported month. This comes on, up from August's upwardly revised reading of 7.190 million. This comes on top of resilient economic growth and persistent price pressures, and solidifies bets for an imminent Fed rate hike, keeping the non-yielding bullion below the $3,970 resistance zone.
Meanwhile, the geopolitical risk premium remains in play despite efforts for a diplomatic resolution to end the eight-month-old US-Iran war. In the latest developments, President Donald Trump told the Financial Times on Tuesday that the US has no immediate plans to strike Iran despite Israeli Prime Minister Benjamin Netanyahu hinting at an attack later this week. Meanwhile, a senior Iranian official told Reuters that the Strait of Hormuz will reopen only if sanctions are waived and the US naval blockade ends. Furthermore, Iran's Islamic Revolutionary Guard Corps (IRGC) said that four tankers were destroyed after striking mines south of the Strait of Hormuz. This fuels oil supply risks and inflation fears stemming from volatile energy prices, which underpin prospects for further Fed policy tightening.
Traders now look forward to Wednesday's US economic docket – featuring the release of the ADP report on private-sector employment and ISM Services PMI. Apart from this, the incoming geopolitical headlines could provide some impetus to gold. Meanwhile, the focus remains glued to the closely watched US monthly employment details, popularly known as the Nonfarm Payrolls (NFP) report on Friday, which will influence USD demand and determine the near-term trajectory for the precious metal. Nevertheless, the aforementioned fundamental backdrop makes it prudent to wait for a sustained move beyond the $3,970 hurdle before confirming that the XAU/USD pair has bottomed out and positioning for any meaningful recovery from the lowest level since September 2025, touched last Friday.
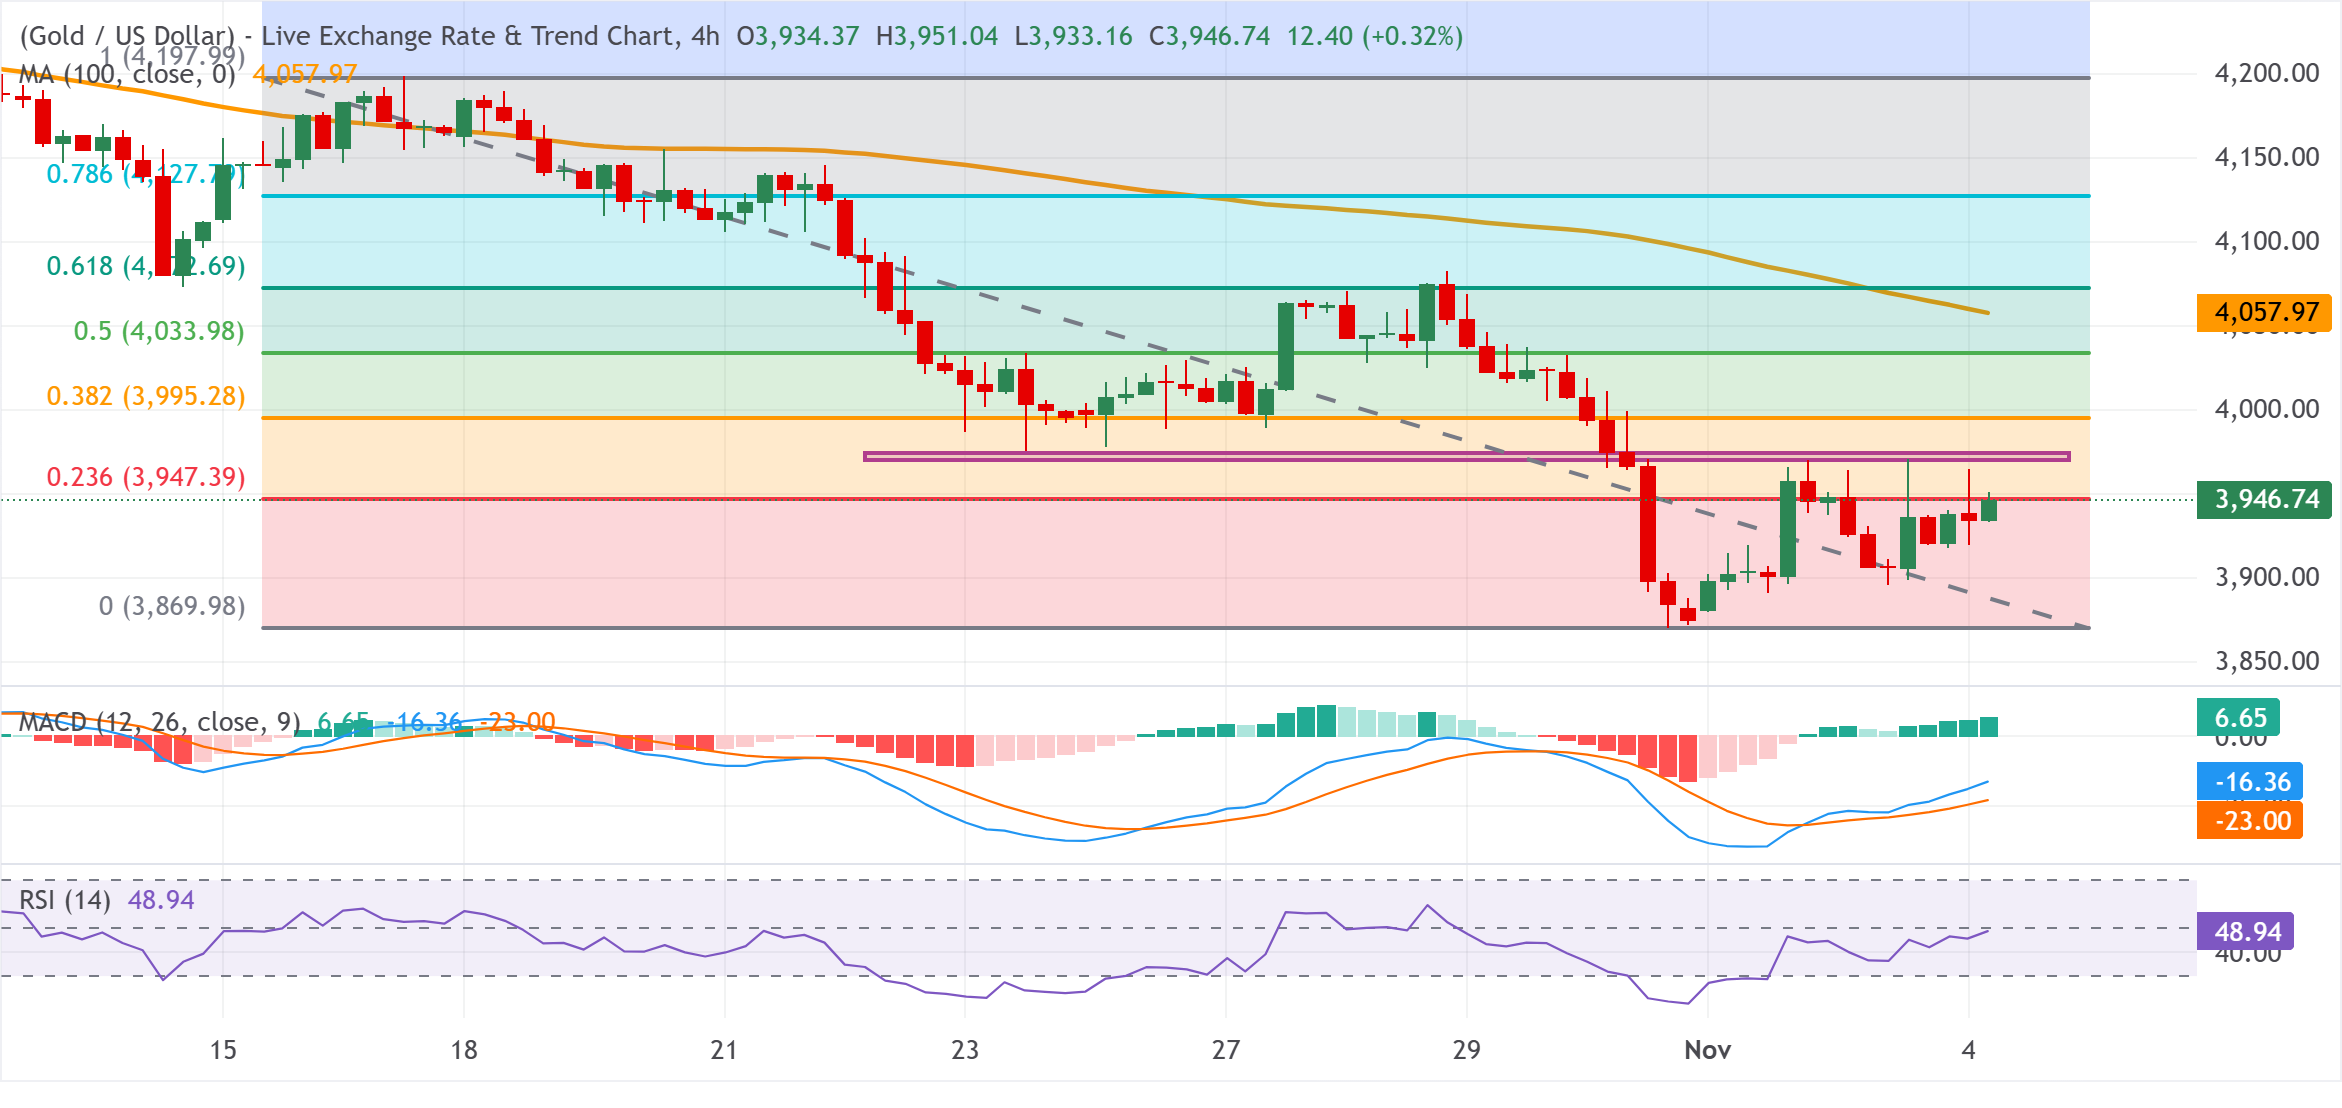
XAU/USD 4-hour chart
Technical Analysis
The XAU/USD maintains a bearish bias below the 100-period Simple Moving Average (SMA) on the 4-hour chart and all key Fibonacci retracement levels of the fall from the mid-October highs, with the 23.6% retracement at $3,947 acting as immediate overhead resistance ahead of the $3,970 zone. Meanwhile, the Relative Strength Index (RSI) at 48.94 sits near neutral while the Moving Average Convergence Divergence (MACD) remains positive at 6.65, hinting at some stabilizing momentum but not yet strong enough to challenge the prevailing downside structure.
In the meantime, a sustained strength beyond the $3,970 hurdle would expose the 38.2% level at $3,995 before the Gold price climbs to the 50.0% retracement at $4,033. Above these, the 100-period SMA at $4,057 and the 61.8% and 78.6% retracements at $4,072 and $4,127, respectively, precede the cycle high near $4,197. On the downside, the main structural support is seen at the Fibonacci anchor around $3,869, where buyers could attempt to reassert a floor if bearish pressure extends.
(The technical analysis of this story was written with the help of an AI tool. Know more.)
US midterm elections FAQs
The US midterm elections are the federal elections held halfway through a president's four-year term. Voters choose all 435 members of the House of Representatives, about one-third of the Senate, and, in many states, governors and other state and local officials.
Election Day is Tuesday, November 3, 2026. Federal law sets it as the Tuesday after the first Monday in November. Early voting and mail voting are already under way in many states.
They decide which party controls each chamber of Congress for the last two years of President Donald Trump's term. The majority party sets the legislative agenda, chooses committee leaders and, in the Senate, controls confirmations of judges and senior officials.
No. The president is elected every four years; the next presidential election is in November 2028. Midterms are often seen as a referendum on the sitting president's party, which historically tends to lose House seats.
Most analysts expect a modest, short-lived reaction in the US Dollar rather than a lasting trend. A divided Congress is widely seen as the base case and is partly priced in. Treasury yields may react more noticeably to the results. Outcomes that raise expectations of fiscal stimulus tend to lift yields and the US Dollar, while gridlock that limits new spending can pull both lower. Political friction, such as funding or debt-ceiling standoffs, can also briefly lift the Dollar as a safe haven. Over six to twelve months, growth and Federal Reserve policy matter more than the vote.
US stocks have historically been weak before midterms and strong after them. Since 1950, the S&P 500 has been higher 12 months after every midterm election, 19 out of 19, with an average gain of about 15%. Analysts link the pattern to uncertainty fading once results are known. Past performance does not guarantee future returns, and some strategists note that high valuations in 2026 could test the streak.
Markets have often welcomed a divided government because gridlock makes sweeping changes to taxes, spending and regulation less likely. Under a Republican president, the S&P 500 has historically done well in years following midterms that split control of Congress. The risks are funding deadlines, debt-ceiling fights and congressional investigations, which can add short-term volatility.
Related Articles