- Trading
- Trading
- Markets
- Markets
- Products overview
- Forex
- Commodities
- Metals
- Indices
- Shares
- Cryptocurrencies
- Treasuries
- ETFs
- Accounts
- Accounts
- Compare our accounts
- Our spreads
- Funding & withdrawals
- Volume rebates
- Open account
- Try free demo
- Platforms & tools
- Platforms & tools
- Platforms
- Platforms
- Platforms overview
- TradingView
- MetaTrader 4
- MetaTrader 5
- MetaTrader Copy Trading
- cTrader
- cTrader copy trading
- Mobile trading platforms
- GO WebTrader
- PAMM
- Premium trading tools
- Premium trading tools
- Tools overview
- VPS
- Genesis
- Education
- Education
- Resources
- Resources
- News & analysis
- Education hub
- Economic calendar
- Earnings announcements
- Help & support
- Help & support
- About
- About
- About GO Markets
- Our awards
- Sponsorships
- Client support
- Client support
- Contact us
- FAQs
- Quick support
- Holiday trading hours
- Maintenance schedule
- Fraud and scam awareness
- Legal documents
- Trading
- Trading
- Markets
- Markets
- Products overview
- Forex
- Commodities
- Metals
- Indices
- Shares
- Cryptocurrencies
- Treasuries
- ETFs
- Accounts
- Accounts
- Compare our accounts
- Our spreads
- Funding & withdrawals
- Volume rebates
- Open account
- Try free demo
- Platforms & tools
- Platforms & tools
- Platforms
- Platforms
- Platforms overview
- TradingView
- MetaTrader 4
- MetaTrader 5
- MetaTrader Copy Trading
- cTrader
- cTrader copy trading
- Mobile trading platforms
- GO WebTrader
- PAMM
- Premium trading tools
- Premium trading tools
- Tools overview
- VPS
- Genesis
- Education
- Education
- Resources
- Resources
- News & analysis
- Education hub
- Economic calendar
- Earnings announcements
- Help & support
- Help & support
- About
- About
- About GO Markets
- Our awards
- Sponsorships
- Client support
- Client support
- Contact us
- FAQs
- Quick support
- Holiday trading hours
- Maintenance schedule
- Fraud and scam awareness
- Legal documents
- Home
- News & Analysis
- Trading Strategies, Psychology
- How to maximise your trading strategy using Relative Volume?
- Home
- News & Analysis
- Trading Strategies, Psychology
- How to maximise your trading strategy using Relative Volume?
- Anticipating Relative volume shifts by understanding that they tend to follow on from big news events, such as unexpected results or broader macro factors.
- Combining big volume shifts with a break of a key support or resistance level
- Combining with other technical indicators.
- Use a collection of volume bars vs just one to see the shift in relative volume
 News & AnalysisNews & Analysis
For new traders, it can be difficult to know which indicators to use, the saturation of various moving averages, RSI’s, MACD’s and more can be overwhelming and counterproductive. However, utilising relative volume, as an indicator is one of the most important sources of information for technical traders.
What is Volume?
Volume is quite simply, the volume of the asset traded over a specified time. This volume is usually shown by bars, generally located at the bottom of a price chart. Each bar represents one unit of the corresponding time period’s volume traded. It also shows whether the period ended in the green or red. Volume tends to be reflective of the interest in the asset and is therefore a valuable tool.

Why Relative volume?
Now that there is a clear definition of what volume is, understanding relative volume is straight forward. It has been established that volume is indicative of the amount of the asset traded for that time. Essentially, most assets will have a consistent or average volume that gets traded over a specified time, whether it be an hour, day, or a week. Generally, the longer the time frame, the more weight a trader should give to that average. A large spike in the volume relative to the average is what a trader should be looking for. The volume bars are the best indicators of this. Larger volumes can indicate larger positions being taken and increasing interest. Therefore, increases in relative buying volume can be a leading indicator for a move to the upside. On the contrary, a large red volume bar can be a leading indicator that price drop is about to occur as a large position is exiting.
A rule that many retail traders like to use is to follow the “big money” or institutions. Big institutions cannot just enter or exit their positions quickly like retail traders. Therefore, these institutions leave a trail of their entries and exits, that experienced traders can capitalise on and follow.
Understanding how shifts in volume can indicate, potential break outs, break downs and reversals takes time and practice but is a valuable tool that any trader should utilise to improve their entries and exits.
A few examples of volume indicating changes in price action.
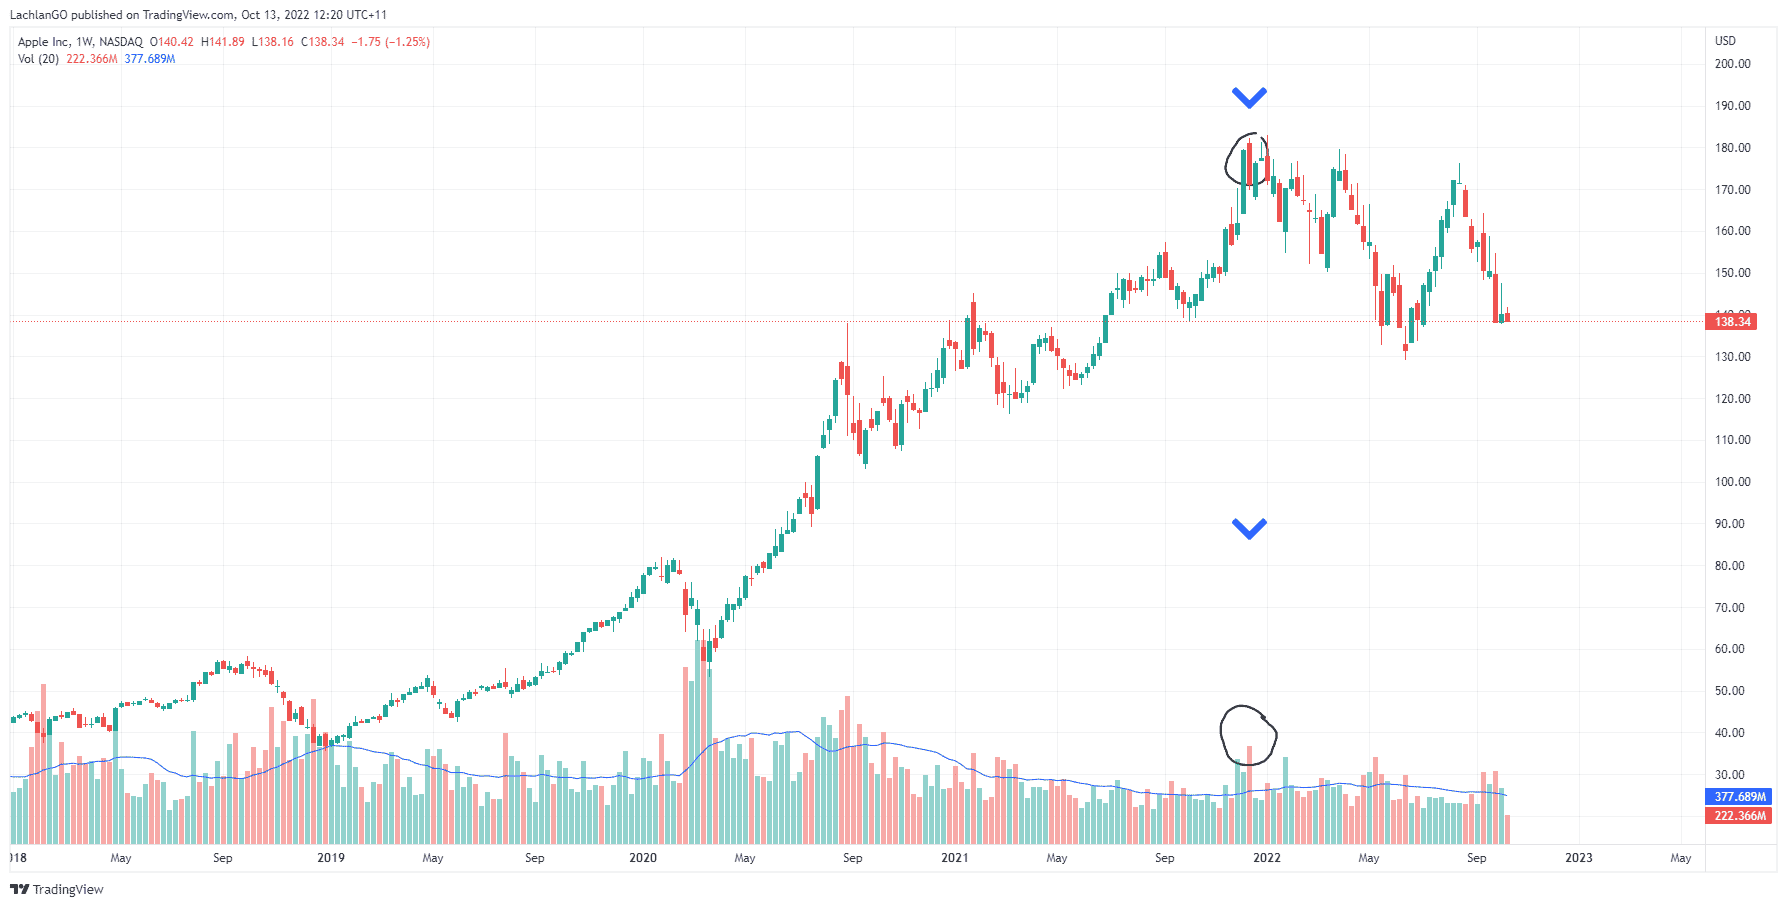
Apple’s sharp increase in selling volume indicated the ‘top’ and has not reached those high since.

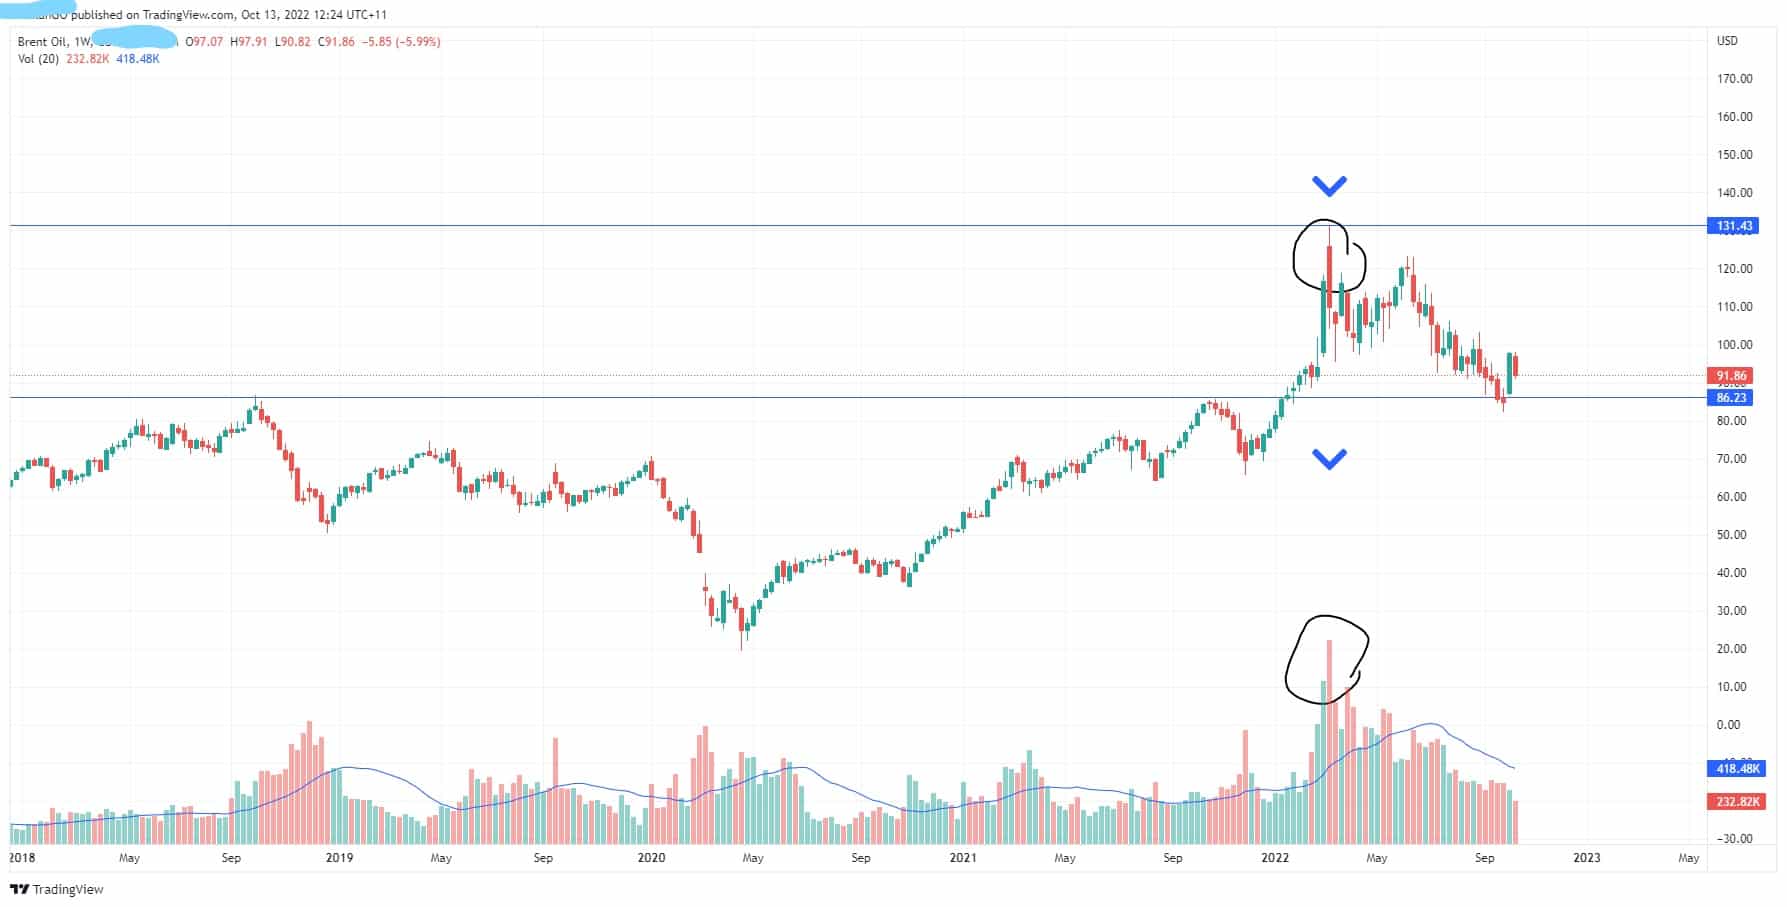
Similarly, the chart for Brent Oil showed a similar pattern whereby it could not breakthrough a long-term resistance level and combined with a large volume of selling signaled that the price had peaked.

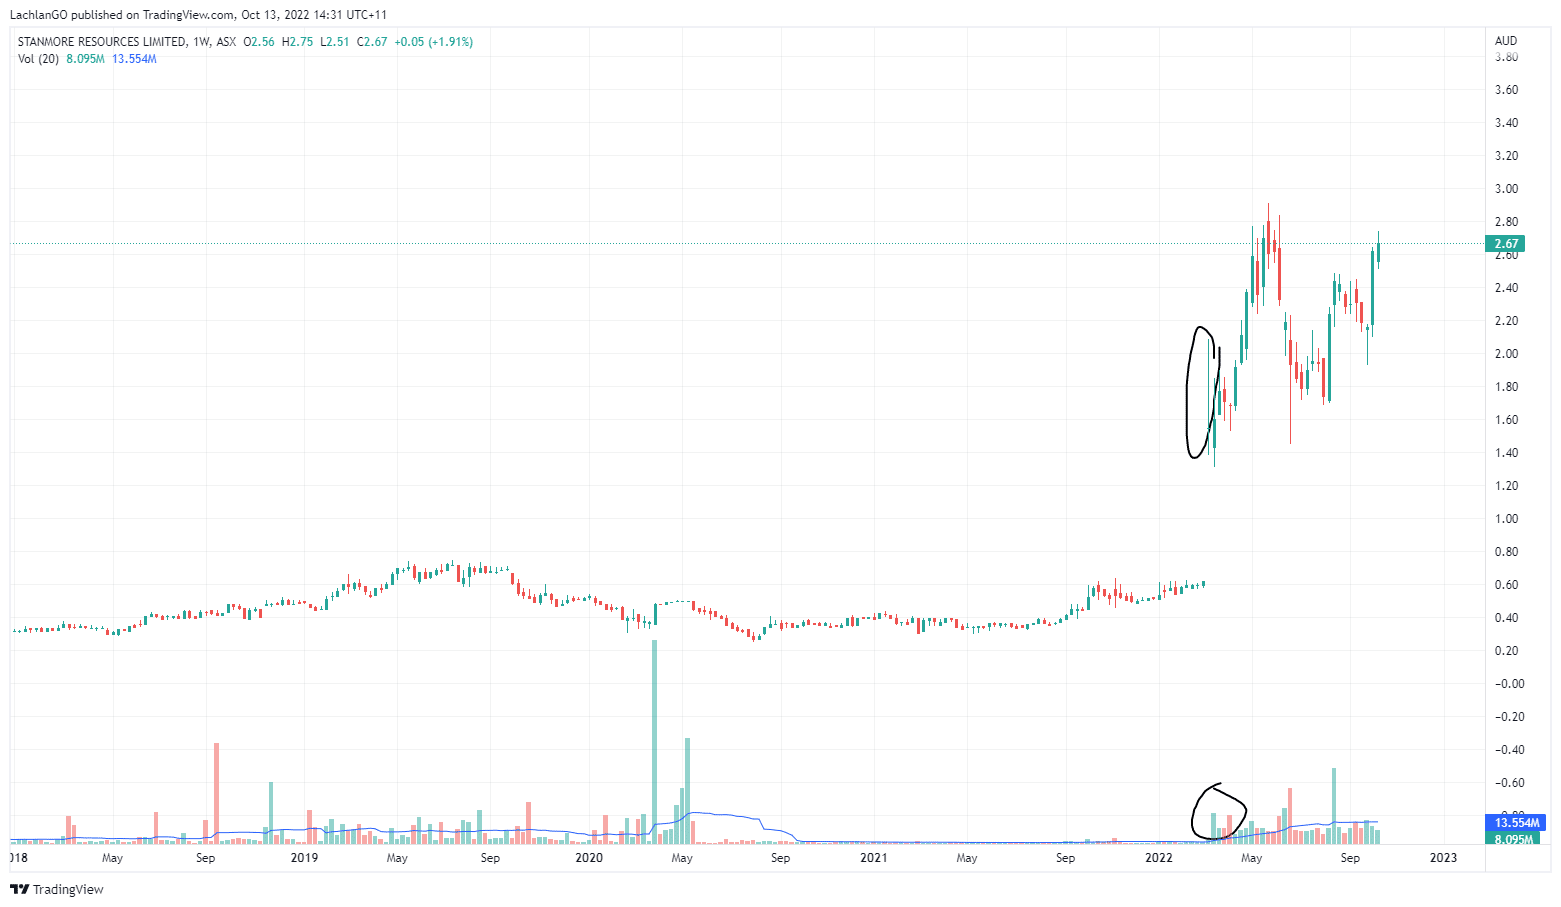
The price for Stanmore Resources saw a big push after the influx of new volume and has its price increase since the first candle. This may indicate that institutions have added the company to its holdings or that significant buying interest has returned.

Further way to optimise using relative volume
Ready to start trading?
Disclaimer: Articles are from GO Markets analysts and contributors and are based on their independent analysis or personal experiences. Views, opinions or trading styles expressed are their own, and should not be taken as either representative of or shared by GO Markets. Advice, if any, is of a ‘general’ nature and not based on your personal objectives, financial situation or needs. Consider how appropriate the advice, if any, is to your objectives, financial situation and needs, before acting on the advice. If the advice relates to acquiring a particular financial product, you should obtain and consider the Product Disclosure Statement (PDS) and Financial Services Guide (FSG) for that product before making any decisions.
Next Article
AUD bounces strongly in line with US equity’s jump
The US indices pumped higher as holders of shorts had to close their positions which resulted in one of the strongest sessions in recent months. The US dollar finally dropped back down, and it gave the AUD some much needed relief and is showing some potential of a short-term reversal. The question remains, whether this bounce will hold, or whether ...
October 14, 2022Read More >Previous Article
Bank of England gives Funds three days to get books in order
The Bank of England has seemingly turned its back on protecting UK Retirement funds, after initially bailing out these funds who were facing serious l...
October 12, 2022Read More >News and Analysis
Join our mailing list to receive market news and monthly newsletters, delivered directly to our inbox.
