- Trading
- Trading
- Markets
- Markets
- Products overview
- Forex
- Commodities
- Metals
- Indices
- Shares
- Cryptocurrencies
- Treasuries
- ETFs
- Accounts
- Accounts
- Compare our accounts
- Our spreads
- Funding & withdrawals
- Dynamic margin
- Volume rebates
- Open account
- Try free demo
- Platforms & tools
- Platforms & tools
- Platforms
- Platforms
- Platforms overview
- TradingView
- MetaTrader 4
- MetaTrader 5
- MetaTrader Copy Trading
- cTrader
- cTrader copy trading
- Mobile trading platforms
- GO WebTrader
- PAMM
- Premium trading tools
- Premium trading tools
- Tools overview
- VPS
- Genesis
- Signal Centre
- Education
- Education
- Resources
- Resources
- News & analysis
- Education hub
- Economic calendar
- Earnings announcements
- Help & support
- Help & support
- About
- About
- About GO Markets
- Our awards
- Sponsorships
- Client support
- Client support
- Contact us
- FAQs
- Quick support
- Holiday trading hours
- Maintenance schedule
- Fraud and scam awareness
- Legal documents
- Trading
- Trading
- Markets
- Markets
- Products overview
- Forex
- Commodities
- Metals
- Indices
- Shares
- Cryptocurrencies
- Treasuries
- ETFs
- Accounts
- Accounts
- Compare our accounts
- Our spreads
- Funding & withdrawals
- Dynamic margin
- Volume rebates
- Open account
- Try free demo
- Platforms & tools
- Platforms & tools
- Platforms
- Platforms
- Platforms overview
- TradingView
- MetaTrader 4
- MetaTrader 5
- MetaTrader Copy Trading
- cTrader
- cTrader copy trading
- Mobile trading platforms
- GO WebTrader
- PAMM
- Premium trading tools
- Premium trading tools
- Tools overview
- VPS
- Genesis
- Signal Centre
- Education
- Education
- Resources
- Resources
- News & analysis
- Education hub
- Economic calendar
- Earnings announcements
- Help & support
- Help & support
- About
- About
- About GO Markets
- Our awards
- Sponsorships
- Client support
- Client support
- Contact us
- FAQs
- Quick support
- Holiday trading hours
- Maintenance schedule
- Fraud and scam awareness
- Legal documents
- Home
- News & Analysis
- Trading Strategies, Psychology
- Optimising trading strategies by using multiple timeframe analysis
- Home
- News & Analysis
- Trading Strategies, Psychology
- Optimising trading strategies by using multiple timeframe analysis
- Determine your standard trading timeframe.
- Work back usually by a factor a factor of 4/5 or by a logical time frame adjustment
- Add in Support and Resistance Lines on longer term time frames
- Revert to trading time frame and redo the same process highlighting convergences
 News & AnalysisNews & Analysis
Optimising trading strategies by using multiple timeframe analysis
3 October 2022 By GO MarketsMany trading strategies utilise technical analysis to predict price patterns and for entries and exits. These strategies revolve often begin with the idea of the price having identifiable support, resistance and trendline market structures which indicate where various buying and selling points can be placed for a trade. These support and resistance indicate far more then just the price at a moment in time. Rather they reflect the psychology of the market at a given point in time.
However, when trading it is important to remember that the market is not just made of one type of trader. The market is made up of day traders, swing traders, scalpers, funds, hedge funds, retirement funds, Investment banks and all in between. Each of these participants has their own time frame for a trade/investment. This element is the key as to why trader can utilise multiple time frame analysis. The theory it that the more market participant who view the respective level as a support or resistance, the more likely it will act in that way.
For example
Assume that the price of stock A is sitting on a 5-minute support at $100. Looking purely at this 5-minute chart a trader may look to buy on this support level.
However, after looking at the 30-minute chart, the chart shows that the price is not actually a support but rather just a random price point and therefor no trade is entered.
Alternatively, the 30-price chart supports the original price as a support and therefore may support the price point being a support point.
How to implement multiple analysis into your trading.
This step should be a relatively simple step if you have a clear edge. For some traders it can be 5 minutes, 15 minutes, 1 hour, one day or even one week.
Prior to your first drawing of support resistance and trendline it is important that you adjust the timeframe of your price chart by a factor of 4/5 or a by logical adjustment such as an hour – to a day or day to week.
Example
5min – 30 min
1 hour – 4 hours
1 hour – day
1 day – 1 week
1 week – 1 month
The analysis can now start, and the key is to draw the most obvious and consistent support and resistance time frames. This step also serves an important step in helping determine if the price is trending or is ranging.
The next step is to revert to the desired trading time frame and conduct the same process. This time if there is a Support/resistance line that is already made and acts as one on the shorter timeframe, highlight it or tag it.
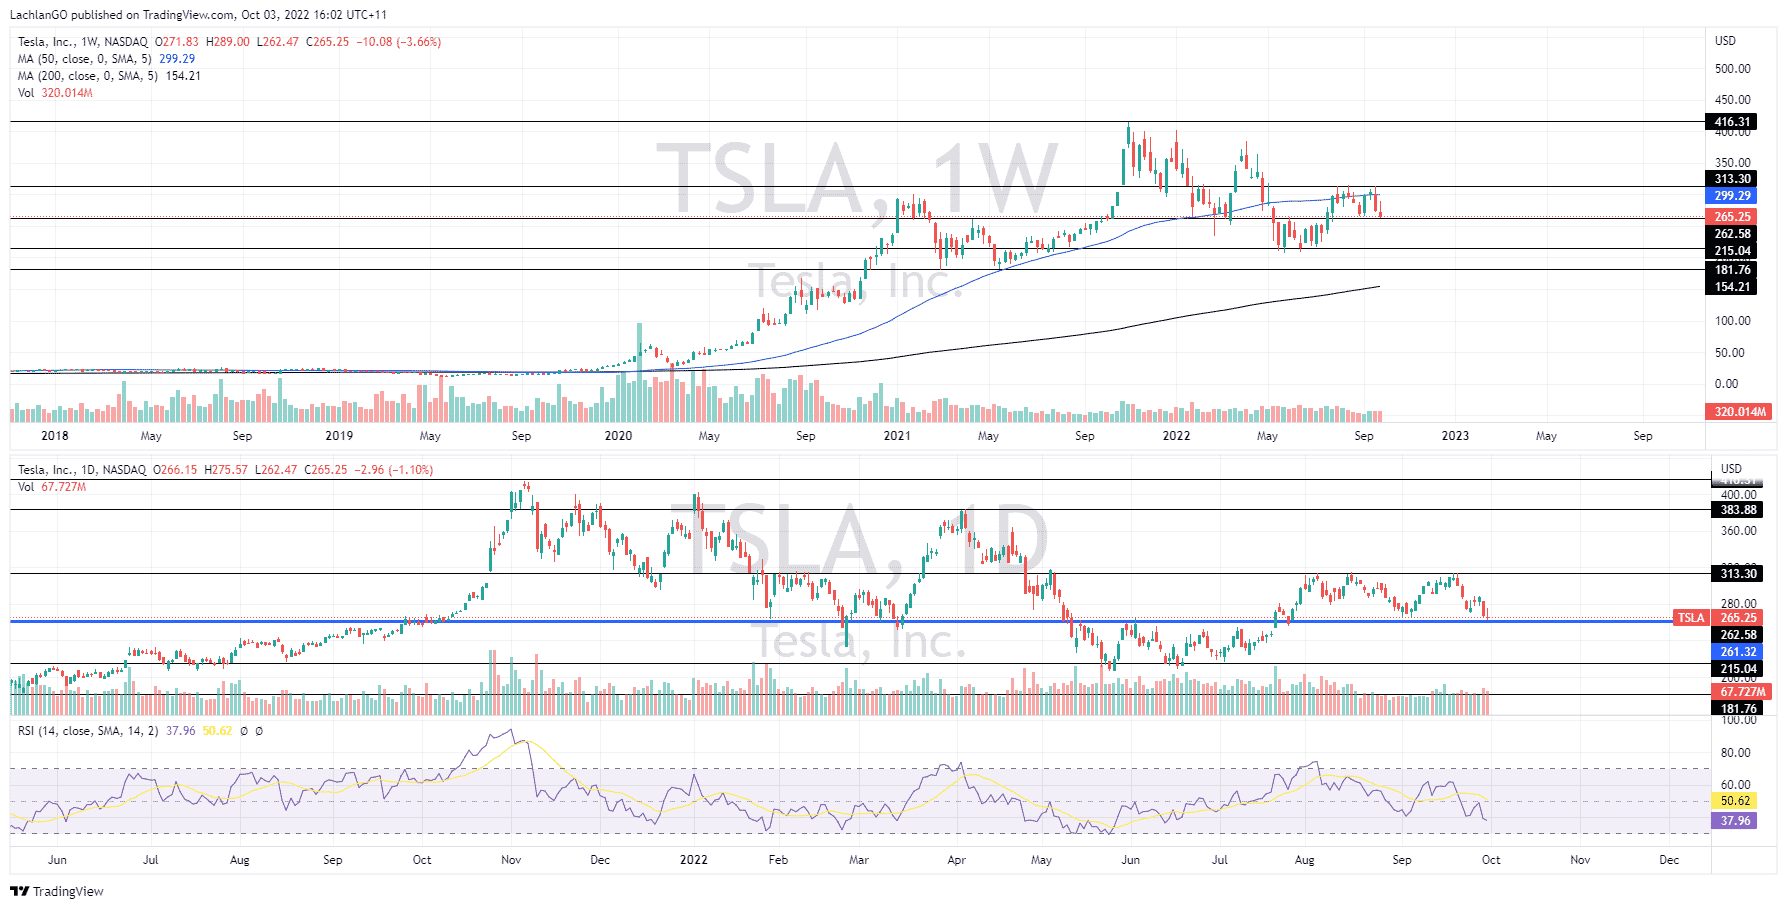
Looking at the example below for US car making company Tesla, the process is shown on the chart below. Firstly, with the weekly chart, support and resistance points were plotted with the black lines.

The below the daily chart shows that the support point at $265.25 acts as support for both timeframes. This indicates that price may act with more strength as a support zone. Similarly, if the level breaks it may indicate a more powerful move because more market participant will likely be involved.
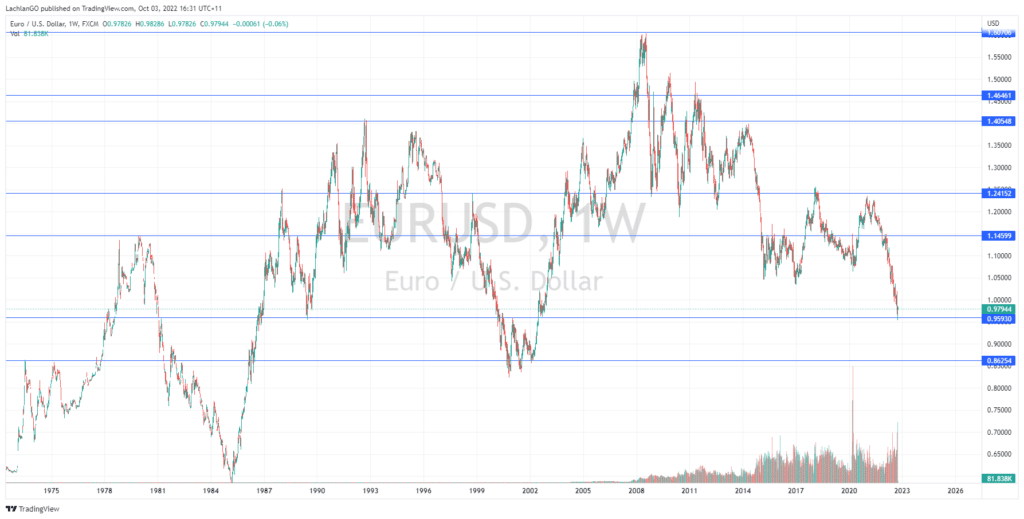
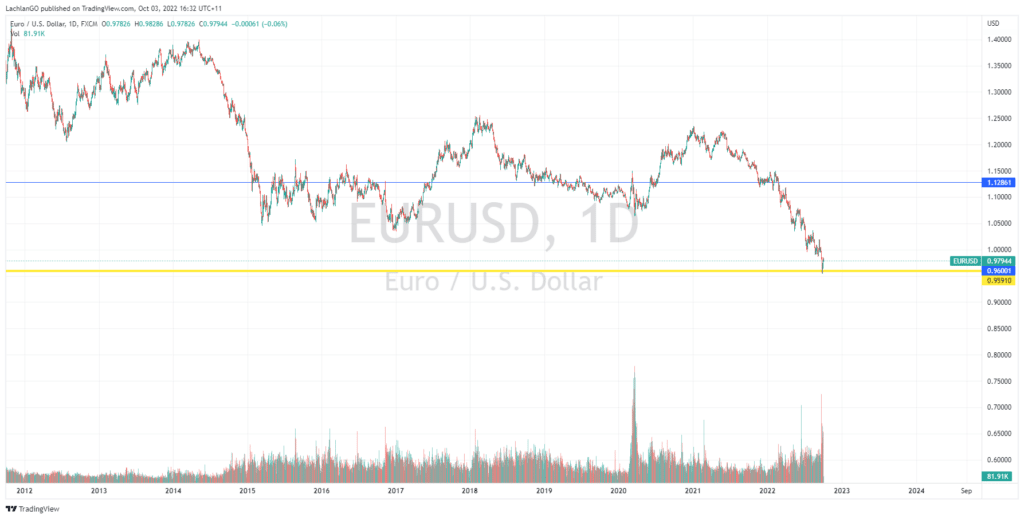
In the other example for the EURUSD the same process has been done and shows that the price at 0.9600 is also doubling as a support on the daily and weekly charts.


The use of multiple time frame analysis can optimise trading systems by reducing risks of fake breakouts and improving entry and exit accuracy.
Ready to start trading?
Disclaimer: Articles are from GO Markets analysts and contributors and are based on their independent analysis or personal experiences. Views, opinions or trading styles expressed are their own, and should not be taken as either representative of or shared by GO Markets. Advice, if any, is of a ‘general’ nature and not based on your personal objectives, financial situation or needs. Consider how appropriate the advice, if any, is to your objectives, financial situation and needs, before acting on the advice. If the advice relates to acquiring a particular financial product, you should obtain and consider the Product Disclosure Statement (PDS) and Financial Services Guide (FSG) for that product before making any decisions.
Next Article
Tesla sets a new record
Tesla Inc. (NASDAQ: TSLA) reported its Q3 2022 delivery numbers on Sunday. World’s largest automaker delivered a total of 343,830 cars (up by 42.49% year-over-year) in the third quarter – setting a new quarterly record. The deliveries in Q3 consisted of: 18,672 Model S/X 325,158 Model 3/Y The automaker produced 365,923 vehicles...
October 4, 2022Read More >Previous Article
Natural Gas getting ready to test important level
Natural Gas prices have had a volatile year to say the least. After finding multi decade highs on the back of geo-political volatility and record high...
September 30, 2022Read More >News and Analysis
Join our mailing list to receive market news and monthly newsletters, delivered directly to our inbox.
