- Trading
- Trading
- Markets
- Markets
- Products overview
- Forex
- Commodities
- Metals
- Indices
- Shares
- Cryptocurrencies
- Treasuries
- ETFs
- Accounts
- Accounts
- Compare our accounts
- Our spreads
- Funding & withdrawals
- Volume rebates
- Open account
- Try free demo
- Platforms & tools
- Platforms & tools
- Platforms
- Platforms
- Platforms overview
- TradingView
- MetaTrader 4
- MetaTrader 5
- MetaTrader Copy Trading
- cTrader
- cTrader copy trading
- Mobile trading platforms
- GO WebTrader
- PAMM
- Premium trading tools
- Premium trading tools
- Tools overview
- VPS
- Genesis
- Education
- Education
- Resources
- Resources
- News & analysis
- Education hub
- Economic calendar
- Earnings announcements
- Help & support
- Help & support
- About
- About
- About GO Markets
- Our awards
- Sponsorships
- Client support
- Client support
- Contact us
- FAQs
- Quick support
- Holiday trading hours
- Maintenance schedule
- Fraud and scam awareness
- Legal documents
- Trading
- Trading
- Markets
- Markets
- Products overview
- Forex
- Commodities
- Metals
- Indices
- Shares
- Cryptocurrencies
- Treasuries
- ETFs
- Accounts
- Accounts
- Compare our accounts
- Our spreads
- Funding & withdrawals
- Volume rebates
- Open account
- Try free demo
- Platforms & tools
- Platforms & tools
- Platforms
- Platforms
- Platforms overview
- TradingView
- MetaTrader 4
- MetaTrader 5
- MetaTrader Copy Trading
- cTrader
- cTrader copy trading
- Mobile trading platforms
- GO WebTrader
- PAMM
- Premium trading tools
- Premium trading tools
- Tools overview
- VPS
- Genesis
- Education
- Education
- Resources
- Resources
- News & analysis
- Education hub
- Economic calendar
- Earnings announcements
- Help & support
- Help & support
- About
- About
- About GO Markets
- Our awards
- Sponsorships
- Client support
- Client support
- Contact us
- FAQs
- Quick support
- Holiday trading hours
- Maintenance schedule
- Fraud and scam awareness
- Legal documents
- Home
- News & Analysis
- Shares and Indices
- Bullish Technical Reversal Trend
- The tail should at least be twice the length on the body.
- The color of the body is not very important but it helps in identifying the strength of the bullish presence.
- There should be no tail or a very little one above the body.
News & AnalysisBy Deepta Bolaky
“Buy the Dips” and “Sell the Rallies” are widely followed strategies by new or experienced traders. Buy-the-dip strategy is becoming increasingly popular based on the theory of market fluctuations. It takes into consideration that the market will eventually rally up at pre-dip prices at some point.
“Nowadays, traders take advantage of market weakness and embrace it”
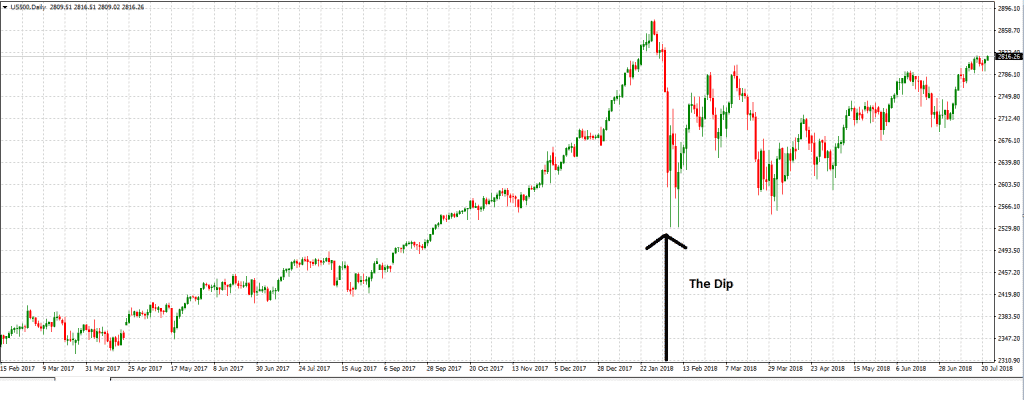
An example of the “buy the dip” approach is the bull stock market where we have seen signs of rebound after a period of deep weakness. Back in February, “buy the dip” was mentioned across various media channels and traders were desperate to find the bottom that would be the most profitable. This strategy will effectively work if traders can identity the transition from a bearish trend to a bullish one.
US500 (S&P 500)

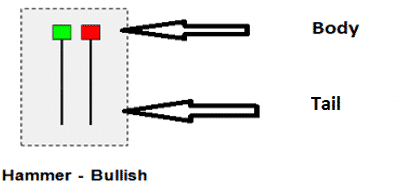
Source: GO Markets MT4Today, we will focus on the Bullish Hammer which is a pattern used to identity a bullish technical reversal. The bullish hammer takes the form of a hammer – it consists of a “long lower tail” and a “body” with little or no upper wick. Generally, traders tend to see if the lower tail is twice or more than the body itself. The below screenshot gives you an indication of a “Hammer”.
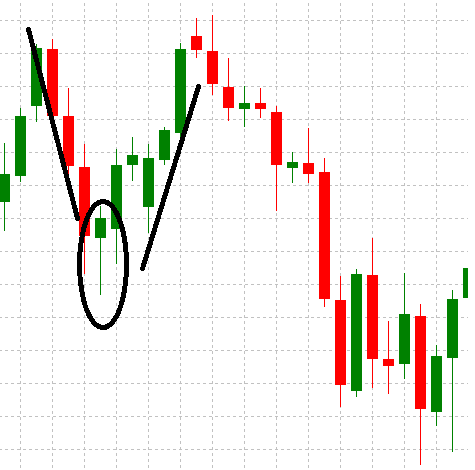
When you see a “hammer” being formed after a downtrend, this is a sign of a potential reversal as the trading action suggests that the trend was heading downwards but manage to find meaningful buyers at a lower price driving the price higher on the close of the candle.

As per the above picture, both the green and red hammer have bullish implications but the green indicates a slightly more bullish presence. Similarly, a shorter “lower tail” is interpreted as less bullish compared to a longer “lower tail”. Put simply, the longer lower tail indicates a stronger presence of buyers.

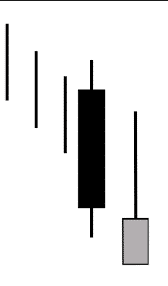
The inverted hammer is also an indication of a potential reversal. An inverted candle is found at the end of a downtrend and has similar criteria to the Hammer.
However, the inverted hammer indicates that buyers are stepping in, but sellers are still present.

Main criteria of a Hammer or the Inverted Hammer:
Note: It is important to differentiate between a “Hammer” and a “Hanging Man”. Because the shape of both candle sticks is similar, traders might misinterpret the patterns. The Hammer lies at the end of a downtrend where as the Hanging Man lies at the end of an uptrend hinting at a reversal of an upward trend.
The hammer is a good indication of a potential reversal and can help traders in establishing the needed bottom to adopt the “Buy-the-dip” approach. However, alongside with the hammer, traders use other indications of price support to recognize the strength of a reversal. It should be highlighted that this strategy is not a “guaranteed profitable strategy” and should be used wisely.
Go Markets Pty Ltd
Ready to start trading?
Disclaimer: Articles are from GO Markets analysts and contributors and are based on their independent analysis or personal experiences. Views, opinions or trading styles expressed are their own, and should not be taken as either representative of or shared by GO Markets. Advice, if any, is of a ‘general’ nature and not based on your personal objectives, financial situation or needs. Consider how appropriate the advice, if any, is to your objectives, financial situation and needs, before acting on the advice. If the advice relates to acquiring a particular financial product, you should obtain and consider the Product Disclosure Statement (PDS) and Financial Services Guide (FSG) for that product before making any decisions.
Next Article
Are the bond markets overwhelming or intimidating?
By Deepta Bolaky The intermarket relationships between commodities, currency, equity and bond markets are key in understanding the way the markets interact and move. Some markets will move with each other while others will move against each other. There are different types of bonds but for the purpose of this article, we will use the U.S Treas...
August 7, 2018Read More >Previous Article
World’s Largest Stock Exchanges
Almost every country in the world has a stock exchange with some countries having multiple exchanges. There are over 60 major exchanges across the glo...
July 30, 2018Read More >News and Analysis
Join our mailing list to receive market news and monthly newsletters, delivered directly to our inbox.

