- Trading
- Trading
- Markets
- Markets
- Products overview
- Forex
- Commodities
- Metals
- Indices
- Shares
- Cryptocurrencies
- Treasuries
- ETFs
- Accounts
- Accounts
- Compare our accounts
- Our spreads
- Funding & withdrawals
- Volume rebates
- Open account
- Try free demo
- Platforms & tools
- Platforms & tools
- Platforms
- Platforms
- Platforms overview
- TradingView
- MetaTrader 4
- MetaTrader 5
- MetaTrader Copy Trading
- cTrader
- cTrader copy trading
- Mobile trading platforms
- GO WebTrader
- PAMM
- Premium trading tools
- Premium trading tools
- Tools overview
- VPS
- Genesis
- Education
- Education
- Resources
- Resources
- News & analysis
- Education hub
- Economic calendar
- Earnings announcements
- Help & support
- Help & support
- About
- About
- About GO Markets
- Our awards
- Sponsorships
- Client support
- Client support
- Contact us
- FAQs
- Quick support
- Holiday trading hours
- Maintenance schedule
- Fraud and scam awareness
- Legal documents
- Trading
- Trading
- Markets
- Markets
- Products overview
- Forex
- Commodities
- Metals
- Indices
- Shares
- Cryptocurrencies
- Treasuries
- ETFs
- Accounts
- Accounts
- Compare our accounts
- Our spreads
- Funding & withdrawals
- Volume rebates
- Open account
- Try free demo
- Platforms & tools
- Platforms & tools
- Platforms
- Platforms
- Platforms overview
- TradingView
- MetaTrader 4
- MetaTrader 5
- MetaTrader Copy Trading
- cTrader
- cTrader copy trading
- Mobile trading platforms
- GO WebTrader
- PAMM
- Premium trading tools
- Premium trading tools
- Tools overview
- VPS
- Genesis
- Education
- Education
- Resources
- Resources
- News & analysis
- Education hub
- Economic calendar
- Earnings announcements
- Help & support
- Help & support
- About
- About
- About GO Markets
- Our awards
- Sponsorships
- Client support
- Client support
- Contact us
- FAQs
- Quick support
- Holiday trading hours
- Maintenance schedule
- Fraud and scam awareness
- Legal documents
- Home
- News & Analysis
- Forex
- Technical Analysis – Retracement for US Dollar
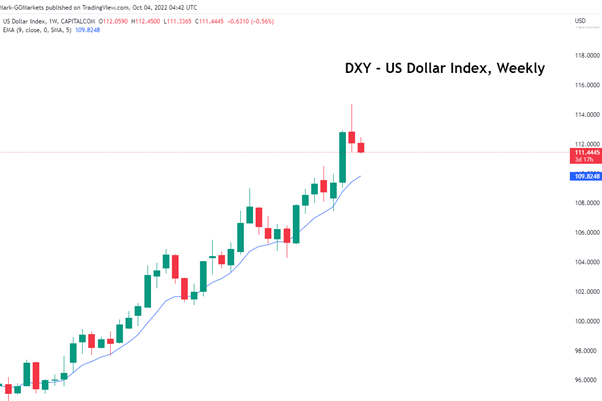
News & AnalysisStarting from the weekly timeframe, US Dollar Index has been consistently trending upwards for the last 16 months. Using the 9 exponential moving average (EMA) on the weekly time frame, we can see the US Dollar retracing back to the EMA, bouncing off of it, then continuing with the trend, as seen below:

Looking at the structure of the uptrend, last week’s candlestick closed bearish, perhaps signalling a retracement back to the 9 EMA on the weekly time frame.
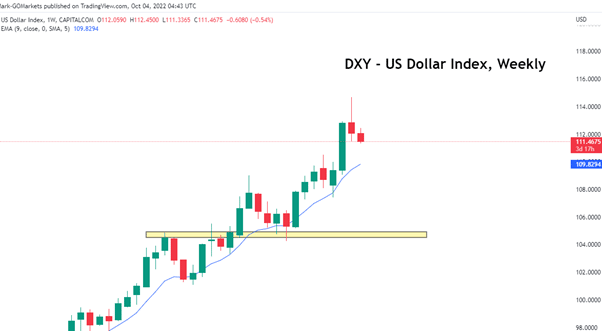
Breaking down the movements of the uptrend, generally the higher highs create a floor for the pullback. For example:

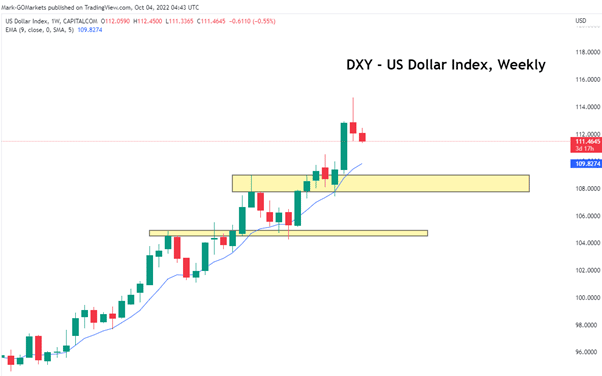
Taking this into consideration, if the US Dollar continues to retrace back to the 9 EMA, the last higher high can be used as a base level for the potential floor, or the end of the retracement:

The range is between $108.45 to $109 as the potential target for the US Dollar.
Ready to start trading?
Disclaimer: Articles are from GO Markets analysts and contributors and are based on their independent analysis or personal experiences. Views, opinions or trading styles expressed are their own, and should not be taken as either representative of or shared by GO Markets. Advice, if any, is of a ‘general’ nature and not based on your personal objectives, financial situation or needs. Consider how appropriate the advice, if any, is to your objectives, financial situation and needs, before acting on the advice. If the advice relates to acquiring a particular financial product, you should obtain and consider the Product Disclosure Statement (PDS) and Financial Services Guide (FSG) for that product before making any decisions.
Next Article
GO Markets Announced as Kooyong Classic 2023 Partner
FRITZ, CILIC JOIN ALCARAZ AND DE MINAUR AT CARE A2+ KOOYONG CLASSIC GO MARKETS ANNOUNCED AS NEW PARTNER Top-ranked American Taylor Fritz and former US Open Champion Marin Cilic are the latest headline acts for the Care A2+ Kooyong Classic in 2023, with Australian-owned online brokerage, GO Markets also announced as a new tournament partner. Fr...
October 7, 2022Read More >Previous Article
EURAUD testing mean of long-term range
The EURAUD buoyed by a weaker Australian Dollar lighter lighter monetary policy from the Reserve Bank of Australia, (RBA) has seen the currency pair m...
October 6, 2022Read More >News and Analysis
Join our mailing list to receive market news and monthly newsletters, delivered directly to our inbox.

