Market News & Insights
What is liquidity? A beginner's guide to market depth and slippage
The Editorial Desk
4/9/2026
•
0 min read
Share this post
Copy URL
On this page
What traders are asking
Sign up

Part five of GO Markets' educational series, explaining how market liquidity can influence pricing, spreads and trading conditions.

You place a trade during a major news event, expecting to get in exactly where you clicked. Instead, your order is filled several points away. Or maybe you close your platform on Friday feeling good about a position, only to open it on Monday morning and find the market has leaped right past your stop loss.

Most traders experience these sudden jumps and unexpected fills and write them off as the market being weird or just bad luck. But these moves are not random. They are the direct mechanical result of a specific market condition.

What liquidity actually means

In trading terms, liquidity is the ability to buy or sell a market at the price you expect, without your order significantly moving the price itself. When a market is highly liquid, it means there are many buyers and sellers actively trading at similar price levels.

How to measure liquidity live

You do not need complex charting tools to gauge if a market is liquid. The most practical way you can measure conditions live on your screen is by looking at the spread and the depth.

Metric 1
Bid-Ask spread

A tight bid-ask spread means high liquidity. A wide spread means low liquidity. When market makers pull their orders, the spread widens mechanically.

Metric 2
Market depth

This is the actual volume of resting orders sitting above and below the current price. Deep market depth can easily absorb large orders without the price jumping.

Gaps and slippage explained

When liquidity disappears, the mechanics of price discovery break down. This creates two distinct phenomena that frequently trap unprepared traders: slippage and gaps.

Step 1
Catalyst or off-hours event hits
→
Step 2
Order book immediately thins out
→
Step 3
Bid-ask spreads widen sharply
→
Step 4
Orders fill at the next available price
Why slippage occurs during execution

Slippage is the difference between the price at which you intend to execute a trade and the price at which the execution actually occurs.

If you click "buy" in a fast-moving market at 1.1050, but the order book is too thin to absorb your trade at that exact level, you might be filled at 1.1055. It happens because the order book did not have sufficient volume at your intended price to fill the entire order.

How price gaps form overnight

Gapping is a price move between one session's close and the next session's open with no trading in between. For example, if a stock closes at US$100 on Friday and opens at US$95 on Monday morning, it has gapped down.

Because there was no liquidity over the weekend, any stop-loss orders placed at US$98 could not be executed until the market opened at US$95. Gaps are a direct result of liquidity disappearing overnight.

Five conditions that reduce liquidity

Liquidity is not a constant state. It ebbs and flows depending on the time of day, the economic calendar, and overall stress in the financial system.

  • Overnight and weekend sessions: Institutional market makers and major trading desks are closed or running skeleton staff, resulting in far fewer resting orders in the book.
  • Before major data releases: Market makers pull or reduce their orders to avoid being caught on the wrong side of a surprise inflation print, causing the order book to temporarily empty.
  • Public holidays: When major financial centres (London, New York, Tokyo) are closed, key liquidity providers are offline, leaving global book depth significantly reduced.
  • Market open and close: The session open sees order imbalances from overnight news accumulate. The session close sees position squaring. Both create temporary thin conditions.
  • Genuine market stress: Fear causes institutional participants to step back simultaneously, removing liquidity precisely when the market is moving fastest.

The markets most exposed to liquidity risk

Liquidity behaves differently depending on the asset class being traded. Understanding these specific quirks is essential for navigating them.

Gold is highly liquid during peak hours, but in the minute before major data drops, spreads can widen significantly as market makers reduce their exposure. During genuine market panics, gold can fall sharply, not because the safe-haven thesis is broken, but because liquidity stress forces traders to sell all liquid assets to cover margins elsewhere.

Bitcoin and other cryptocurrencies trade 24/7, but weekend liquidity is structurally much thinner than weekday liquidity. You can explore how these two assets behave differently during stress events in our gold vs cryptocurrency guide. Altcoins have significantly less depth than Bitcoin, meaning small orders can move the price substantially.

Liquidity in currency markets follows the sun, peaking when major financial centres like London and New York overlap. For example, AUD/USD is highly liquid during the Tokyo and London overlap, but can fall into thin trading traps at the very start of the Sydney session.

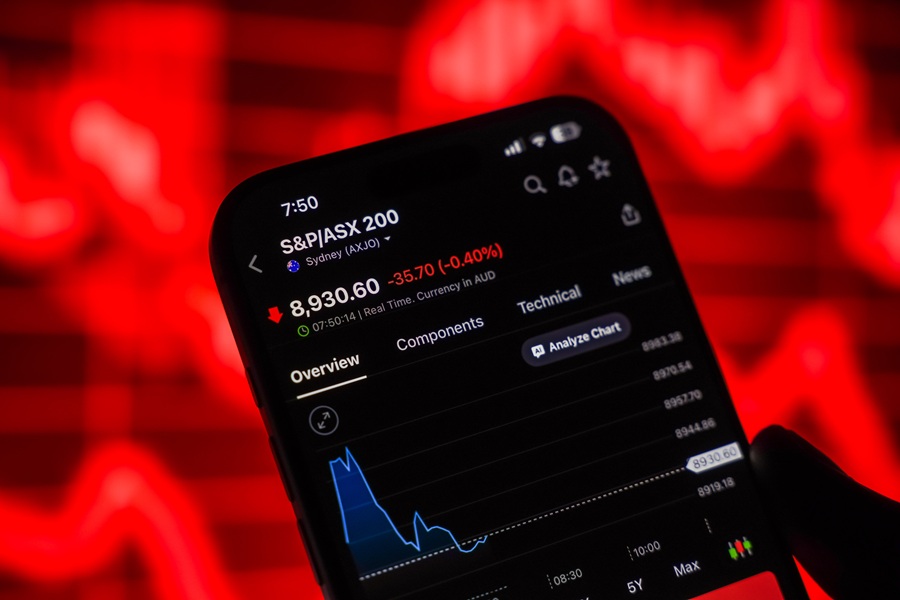
Equity indices like the ASX 200 can gap at the open as overnight news accumulates. The first 15 minutes after the opening bell are typically the most volatile and least reliable directionally as the full order book assembles and liquidity builds.

Test your knowledge

1 / 5
0 correct
0 wrong
CONCEPT CHECK

How sure are you?
Your call

Questions correct
The One-Line Takeaway

Liquidity is not a constant. Slippage and gaps are the direct mechanical cost of trading when the order book thins out.

Related Articles