- Trading
- Trading
- Markets
- Markets
- Products overview
- Forex
- Commodities
- Metals
- Indices
- Shares
- Cryptocurrencies
- Treasuries
- ETFs
- Accounts
- Accounts
- Compare our accounts
- Our spreads
- Funding & withdrawals
- Open CFD account
- Try free demo
- Platforms & tools
- Platforms & tools
- Platforms
- Platforms
- Platforms overview
- GO Markets trading app
- MetaTrader 4
- MetaTrader 5
- cTrader
- cTrader copy trading
- Mobile trading platforms
- GO WebTrader
- Premium trading tools
- Premium trading tools
- Tools overview
- VPS
- Genesis
- Education
- Education
- Resources
- Resources
- News & analysis
- Education hub
- Economic calendar
- Earnings announcements
- Help & support
- Help & support
- About
- About
- About GO Markets
- Our awards
- Sponsorships
- Client support
- Client support
- Contact us
- FAQs
- Quick support
- Holiday trading hours
- Maintenance schedule
- Fraud and scam awareness
- Legal documents
- Trading
- Trading
- Markets
- Markets
- Products overview
- Forex
- Commodities
- Metals
- Indices
- Shares
- Cryptocurrencies
- Treasuries
- ETFs
- Accounts
- Accounts
- Compare our accounts
- Our spreads
- Funding & withdrawals
- Open CFD account
- Try free demo
- Platforms & tools
- Platforms & tools
- Platforms
- Platforms
- Platforms overview
- GO Markets trading app
- MetaTrader 4
- MetaTrader 5
- cTrader
- cTrader copy trading
- Mobile trading platforms
- GO WebTrader
- Premium trading tools
- Premium trading tools
- Tools overview
- VPS
- Genesis
- Education
- Education
- Resources
- Resources
- News & analysis
- Education hub
- Economic calendar
- Earnings announcements
- Help & support
- Help & support
- About
- About
- About GO Markets
- Our awards
- Sponsorships
- Client support
- Client support
- Contact us
- FAQs
- Quick support
- Holiday trading hours
- Maintenance schedule
- Fraud and scam awareness
- Legal documents
- Home
- News & analysis
- Trading Strategies, Psychology
- What is mean reversion?
News & analysisMean reversion strategies are some of the simplest trading strategy’s used by sophisticated traders. However, when most traders hear the term, they immediately get confused. So, what is mean reversion and why do traders use it as a strategy?
Mean reversion is the tendency for the price of an asset to move back to its long-term average or mean after explosive moves to the up or downside. Traders can therefor capitalise on the end of these explosive moves by going long when the price has broken down and will revert up to the mean or short when there has been a strong move to the upside and the price will fall back to the mean.
This strategy is often compared to trend following strategies in which the price tends to moving solely in one direction over a significant period with traders entering at the lows and exiting at the highs. Mean reversion strategies can actually be used conjunction with a trend following strategy as trend following strategies will often pullback to the long-term mean.
What is the mean?
The mean is quite simply the average of a price over a time period. In trading, the average can often be shown by using a moving average of mid points of ranging price. For instance, on a long term a significant average that is seen as the mean is the 200-period moving average. The 200-period moving average is used so often because of its length. It provides an average over a significant period of time. Other averages that are often used include the 50 Period moving average and 100 period moving average. All three can be used in different ways to measure different reversions to the mean.
On a shorter timeframe, the Volume Weighted Average Price of VWAP is often used as a short-term measure of the mean as it adjust the price for the volume traded as well.
What is the premise behind the strategy?
The idea behind the strategy comes from the basic principles of supply and demand. The price of an asset adjusts up and down until the there is a point of equilibrium or where the buyers and sellers reach a stalemate which then becomes the mean. Economic principals say that over time at some stage this phenomenon must occur. Therefore, even if the price of an asset or exploded, at some stage it will have to revert to the mean. In addition, this process will occur regardless of the time frame. Over longer time frames, the process will still occur, although it may take much longer. For instance, if looking at the daily/weekly time frame, the process may take days and weeks to eventuate.
The examples below show how a simple mean reversion strategy can bring about large potential gains. Whilst this strategy can be extremely profitable it can also be risky because it can contradict some of the psychology that trading is built on especially in the short term. The mean reversion strategy requires the market to price assets based purely on the long-term supply and demand and markets do not always act rationally. Emotions such as fear, and anxiety rule the market which lead to price action that can put pressure on these types of strategies.
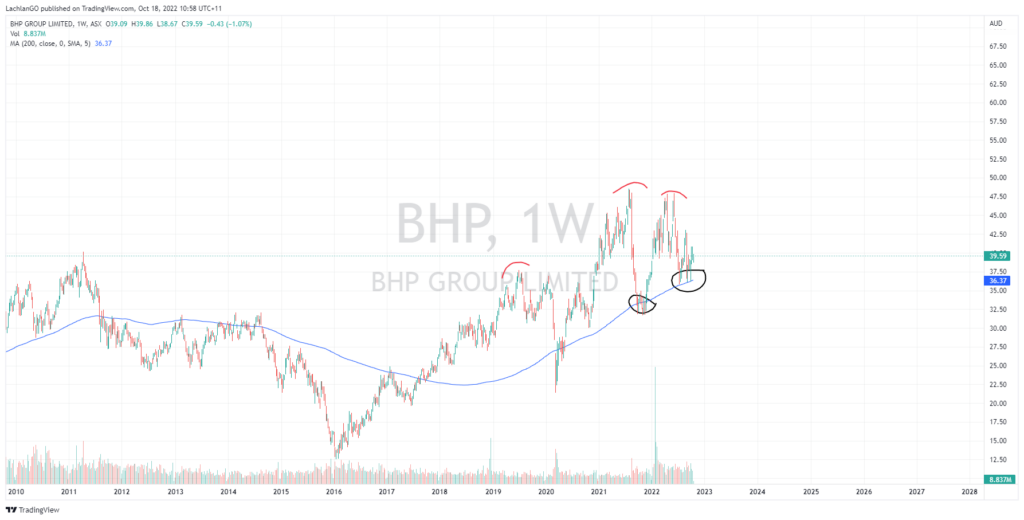
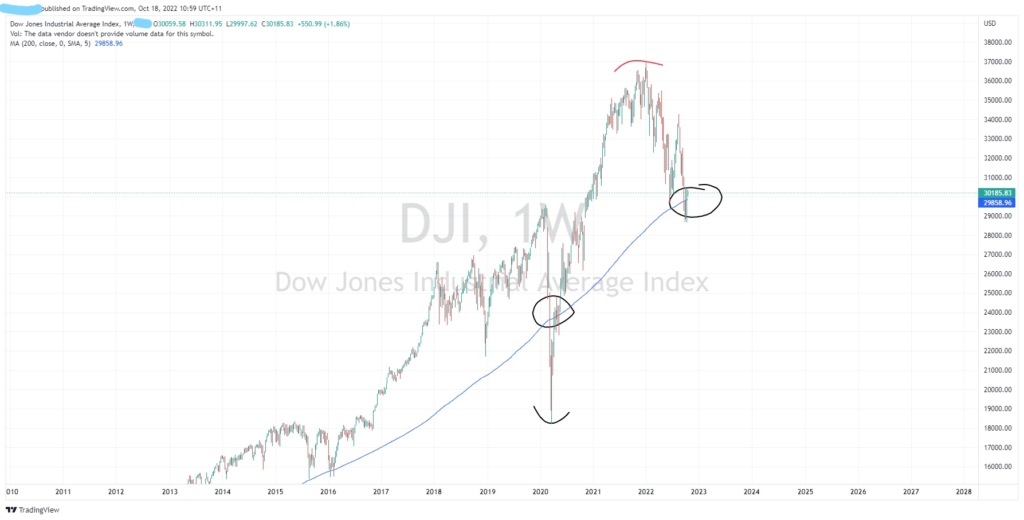
On both examples, after significant price movements towards the upside and downside, the prices peaked or bottomed and then returned to their long term mean indicated by the blue 200 period average..


Utilising a mean reversion strategy can provide high return opportunities for traders who can master the skill and strategy.
Ready to start trading?
The information provided is of general nature only and does not take into account your personal objectives, financial situations or needs. Before acting on any information provided, you should consider whether the information is suitable for you and your personal circumstances and if necessary, seek appropriate professional advice. All opinions, conclusions, forecasts or recommendations are reasonably held at the time of compilation but are subject to change without notice. Past performance is not an indication of future performance. Go Markets Pty Ltd, ABN 85 081 864 039, AFSL 254963 is a CFD issuer, and trading carries significant risks and is not suitable for everyone. You do not own or have any interest in the rights to the underlying assets. You should consider the appropriateness by reviewing our TMD, FSG, PDS and other CFD legal documents to ensure you understand the risks before you invest in CFDs. These documents are available here.
#ForexStrategy #ForexTrading #ForexTraining #ForexCourse #ForexEducation #ForexHelp #ForexAnalysis #FXSignal #MetaTrader #MetaTrader4 #MetaTrader5Next Article
Qantas shares price lift off, but Dividends on hold for FY22
Qantas Airways Limited (QAN:ASX) is the flagship carrier of Australia and the country's largest airline by fleet size. The company has had a resurgence in 2022 and the share price has rebounded from the lows of the pandemic. The “Flying Kangaroo” as it’s known throughout the industry, said that it would report an underlying pre-tax profit ...
October 18, 2022Read More >Previous Article
AUD bounces strongly in line with US equity’s jump
The US indices pumped higher as holders of shorts had to close their positions which resulted in one of the strongest sessions in recent months. The U...
October 14, 2022Read More >Please share your location to continue.
Check our help guide for more info.


