- Trading
- Trading
- Markets
- Markets
- Products overview
- Forex
- Commodities
- Metals
- Indices
- Shares
- Cryptocurrencies
- Treasuries
- ETFs
- Accounts
- Accounts
- Compare our accounts
- Our spreads
- Funding & withdrawals
- Open CFD account
- Try free demo
- Platforms & tools
- Platforms & tools
- Platforms
- Platforms
- Platforms overview
- GO Markets trading app
- MetaTrader 4
- MetaTrader 5
- cTrader
- cTrader copy trading
- Mobile trading platforms
- GO WebTrader
- Premium trading tools
- Premium trading tools
- Tools overview
- VPS
- Genesis
- Education
- Education
- Resources
- Resources
- News & analysis
- Education hub
- Economic calendar
- Earnings announcements
- Help & support
- Help & support
- About
- About
- About GO Markets
- Our awards
- Sponsorships
- Client support
- Client support
- Contact us
- FAQs
- Quick support
- Holiday trading hours
- Maintenance schedule
- Fraud and scam awareness
- Legal documents
- Trading
- Trading
- Markets
- Markets
- Products overview
- Forex
- Commodities
- Metals
- Indices
- Shares
- Cryptocurrencies
- Treasuries
- ETFs
- Accounts
- Accounts
- Compare our accounts
- Our spreads
- Funding & withdrawals
- Open CFD account
- Try free demo
- Platforms & tools
- Platforms & tools
- Platforms
- Platforms
- Platforms overview
- GO Markets trading app
- MetaTrader 4
- MetaTrader 5
- cTrader
- cTrader copy trading
- Mobile trading platforms
- GO WebTrader
- Premium trading tools
- Premium trading tools
- Tools overview
- VPS
- Genesis
- Education
- Education
- Resources
- Resources
- News & analysis
- Education hub
- Economic calendar
- Earnings announcements
- Help & support
- Help & support
- About
- About
- About GO Markets
- Our awards
- Sponsorships
- Client support
- Client support
- Contact us
- FAQs
- Quick support
- Holiday trading hours
- Maintenance schedule
- Fraud and scam awareness
- Legal documents
- Home
- News & analysis
- Shares and Indices
- Gold pushes through $2000 as demand grows during uncertain times
- Home
- News & analysis
- Shares and Indices
- Gold pushes through $2000 as demand grows during uncertain times
 News & analysisNews & analysis
Gold has seen a resurgence in the past few weeks on the back of inflationary pressure and geopolitical tensions in Ukraine and Russia. Prior to the conflict, the price of Gold was hovering around $1,800 USD per ounce. After pushing through $2000 USD per ounce the price is now moving closer to its all-time high at $2070.
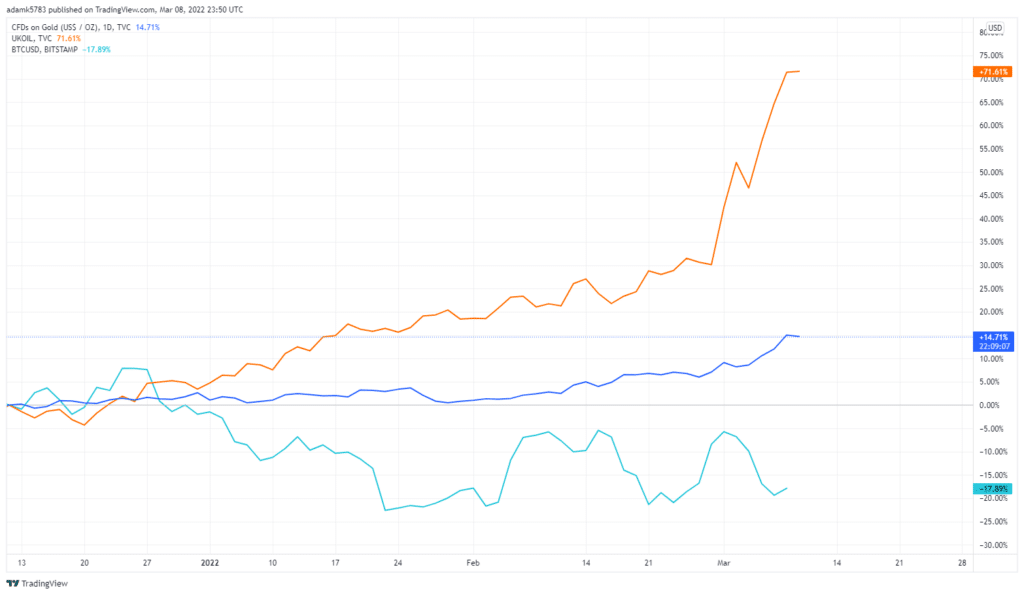
The rise in other commodities such as Oil, Gas, and Coal has also added to the rise in the price of Gold as concerns of inflation are increased, the interest in Gold usually follows. An interesting comparison can be made with regards to the increasing price of Oil. Whilst both commodities can be used as hedges against the market, Gold provides a more stable option whilst Oil is the more volatile option. Both have seen strong rises due to the conflict and whilst Oil’s has been more meteoric, Gold has been steadier, as can be seen in the chart below.
Gold has also performed extremely well against Bitcoin and other cryptocurrencies during the volatility that has been caused by the conflict. There was potential for Bitcoin and Cryptocurrency to provide a hedge against the market, however Bitcoin has been outperformed by Gold at this point.
Gold vs BTC vs Oil

An interesting quandary to the Gold rise is the geopolitical element. For instance, Russia’s central bank purchased more Gold in 2021 than all other central banks, except for those in India and the United Arab Emirates. This means that there may be a shortfall in supply.
Technical Analysis
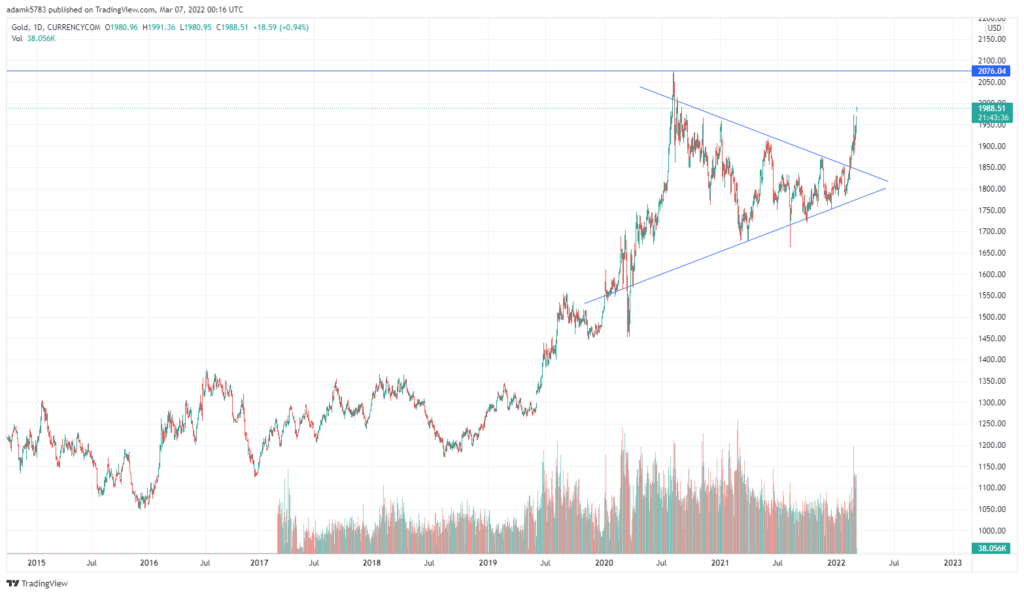
The long-term chart has shown a long period of consolidation ultimately forming a symmetrical triangle pattern from which the price has broken out. It saw a big rise during the beginning of the pandemic and reached a maximum price of $2075 USD per ounce. When the price broke out of the triangle, initially an increase in relative volume occurred. In addition, the retracement of the breakout was short-lived, and buying pushed the price up relatively easily.

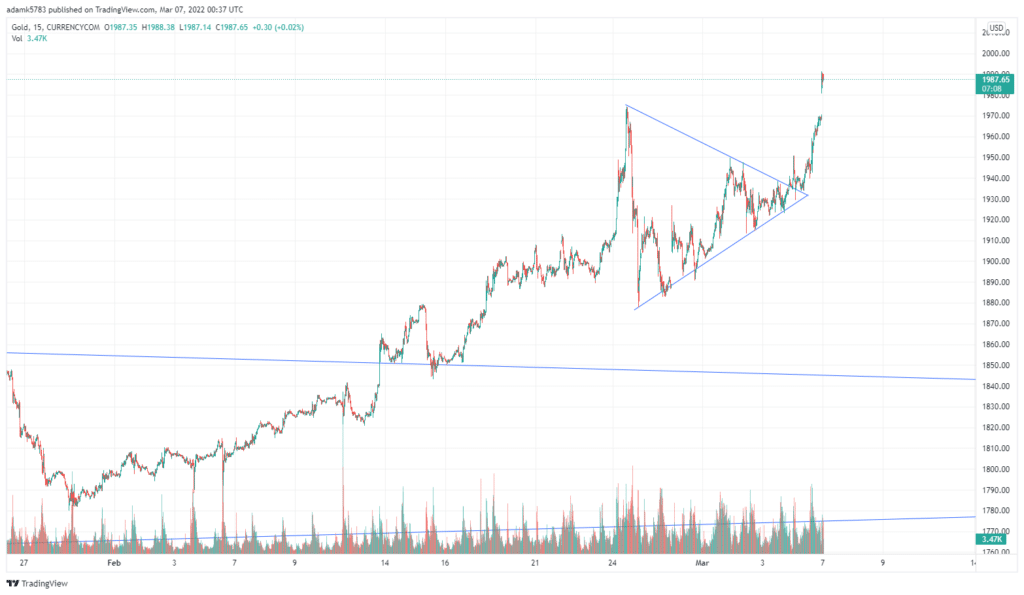
Another symmetrical triangle formed on the four-hour chart on the breakout of the breakout. Once again there was a strong increase in volume for the intimal move before it began the price began to contract again. These continual price contractions and triangles forming may indicate that supply is being soaked up and that buying demand is present.

On the four-hour time frame, it can be observed that the short sharp periods of consolidation have continued to be formed. Importantly, the consolidations have been relatively short, with in a tight range and broken with a high level of volume.

If volatility continues to be prominent and Inflation remains a threat, Gold will likely remain relevant. It will be interesting to see what happens with the price, if it is able to push through the all-time high price of $2075 per ounce.
Ready to start trading?
The information provided is of general nature only and does not take into account your personal objectives, financial situations or needs. Before acting on any information provided, you should consider whether the information is suitable for you and your personal circumstances and if necessary, seek appropriate professional advice. All opinions, conclusions, forecasts or recommendations are reasonably held at the time of compilation but are subject to change without notice. Past performance is not an indication of future performance. Go Markets Pty Ltd, ABN 85 081 864 039, AFSL 254963 is a CFD issuer, and trading carries significant risks and is not suitable for everyone. You do not own or have any interest in the rights to the underlying assets. You should consider the appropriateness by reviewing our TMD, FSG, PDS and other CFD legal documents to ensure you understand the risks before you invest in CFDs. These documents are available here.
#Indice #Indices #IndicesTrading #IndexTrading #Shares #Stockmarket #StocksNext Article
Potential for Ukraine and Russian Negotiations drives a market rebound
The global markets had a strong night of trading on the back of renewed peace talks between Russia and Ukraine. Equity indices were up, whilst commodities took a breather from their recent highs. Reports coming out of Europe indicated that Ukrainian President Volodymyr Zelensky has cooled off on the prospect of Ukraine joining NATO and is open to d...
March 10, 2022Read More >Previous Article
Commodities’ record high prices wreaking havoc for inflation
A sudden rapid increase in commodity prices, propelled by supply concerns stemming from the Russia and Ukraine conflict, has brought about inflationar...
March 9, 2022Read More >Please share your location to continue.
Check our help guide for more info.

