- Trading
- Trading
- Markets
- Markets
- Products overview
- Forex
- Commodities
- Metals
- Indices
- Shares
- Cryptocurrencies
- Treasuries
- ETFs
- Accounts
- Accounts
- Compare our accounts
- Our spreads
- Funding & withdrawals
- Open CFD account
- Try free demo
- Platforms & tools
- Platforms & tools
- Platforms
- Platforms
- Platforms overview
- GO Markets trading app
- MetaTrader 4
- MetaTrader 5
- cTrader
- cTrader copy trading
- Mobile trading platforms
- GO WebTrader
- Premium trading tools
- Premium trading tools
- Tools overview
- VPS
- Genesis
- Education
- Education
- Resources
- Resources
- News & analysis
- Education hub
- Economic calendar
- Earnings announcements
- Help & support
- Help & support
- About
- About
- About GO Markets
- Our awards
- Sponsorships
- Client support
- Client support
- Contact us
- FAQs
- Quick support
- Holiday trading hours
- Maintenance schedule
- Fraud and scam awareness
- Legal documents
- Trading
- Trading
- Markets
- Markets
- Products overview
- Forex
- Commodities
- Metals
- Indices
- Shares
- Cryptocurrencies
- Treasuries
- ETFs
- Accounts
- Accounts
- Compare our accounts
- Our spreads
- Funding & withdrawals
- Open CFD account
- Try free demo
- Platforms & tools
- Platforms & tools
- Platforms
- Platforms
- Platforms overview
- GO Markets trading app
- MetaTrader 4
- MetaTrader 5
- cTrader
- cTrader copy trading
- Mobile trading platforms
- GO WebTrader
- Premium trading tools
- Premium trading tools
- Tools overview
- VPS
- Genesis
- Education
- Education
- Resources
- Resources
- News & analysis
- Education hub
- Economic calendar
- Earnings announcements
- Help & support
- Help & support
- About
- About
- About GO Markets
- Our awards
- Sponsorships
- Client support
- Client support
- Contact us
- FAQs
- Quick support
- Holiday trading hours
- Maintenance schedule
- Fraud and scam awareness
- Legal documents
- Home
- News & analysis
- Oil, Metals, Soft Commodities
- Russia and Ukraine’s Crisis: Brent and Crude Oil Price action
- Home
- News & analysis
- Oil, Metals, Soft Commodities
- Russia and Ukraine’s Crisis: Brent and Crude Oil Price action
- Global benchmark April Brent crude climbed $3.06, or 3.1%, to end at $100.99 a barrel. The contract, which expired at the end of the session, settled at its highest since September 2014, posting a gain of 10.7% for the month.
- West Texas Intermediate crude for April delivery on the New York Mercantile Exchange rose $4.13, or 4.5%, to settle at $95.72 a barrel. The front-month contract finished at the highest since August 2014, up 8.6% for the month, according to Dow Jones Market Data.
 News & analysisNews & analysis
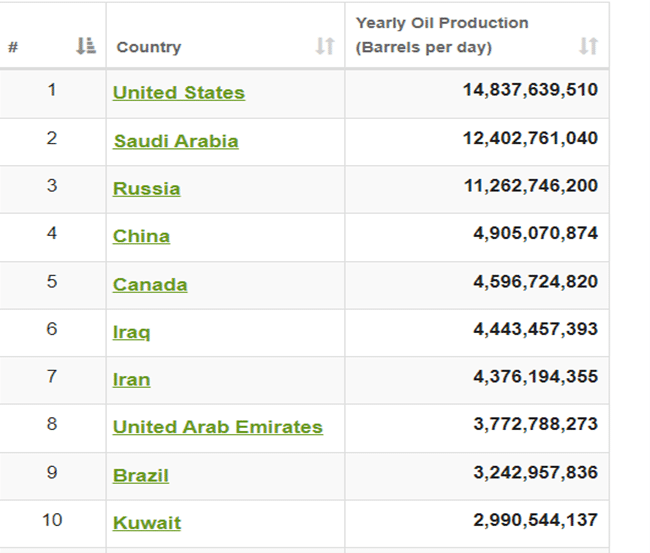
In the midst of the Russian, Ukraine crisis, there are huge ramifications that affect us all in the global market. Energy is a critically important export. Russian oil and gas exports make up a fifth of Russia’s economy and half of its earnings from exports. The country is the European Union’s biggest oil trading partner, according to the latest data from Eurostat. Russia also ranks 5th in the world for oil consumption, accounting for about 3.7% of the world’s total consumption of 97,103,871 barrels per day. They are also ranked 3rd in oil production, which is the most important factor when it comes to costs, sitting close to the oil powerhouses of United States and Saudi Arabia. They are also some way ahead of China, who sits in 4th lagging behind Russia by a wide margin of 6 million barrels per day (Fig.1).

As you can imagine any disruption to any country in this list on a normal day, would trigger a price movement. So a war and subsequent sanctions on a country who controls so much consumption and production of the precious liquid would make more than a ripple.
Latest Price Action
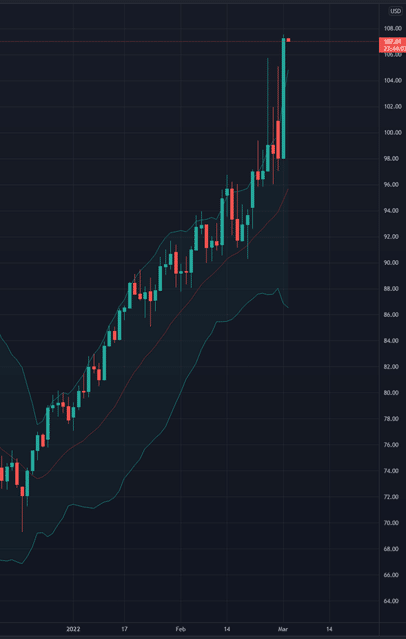
Over the last few days, we have seen Oil prices finished higher each closing day, a sharp increase over night of 9.72% to start today’s session at $106.33 (Fig.2).
Fig. 2

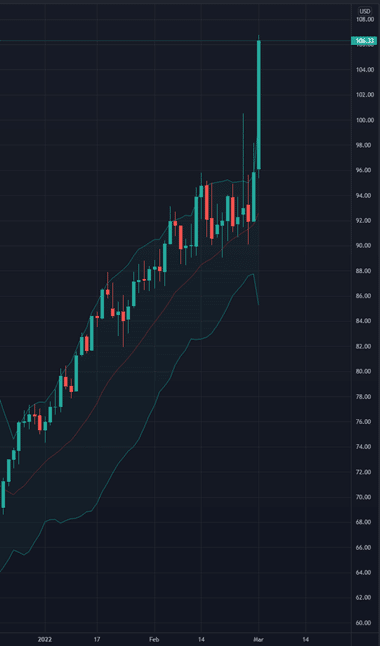
WTI Oil followed suit and had a jump of 11.5%, a sharp increase over night to start today’s session at $106.75 (Fig.3).
Fig. 3

The Wall Street Journal reported that the U.S. and other major oil-consuming countries were weighing the release of 70 million barrels of oil from emergency stockpiles in response to surging crude prices. This is to try to stabilize the oil prices and make up the supply that Russia would normally deliver pre sanctions.
It’s important to tread carefully when trading assets such as these commodities, which are driven by Geopolitics, unforeseen supply and demand levels and corporate institutions around the world who have their own agendas in mind when thinking of their bottom line. Profits.
Sources: QUARTZ, worldometers.info, The Wall Street Journal, Tradingview.
Ready to start trading?
The information provided is of general nature only and does not take into account your personal objectives, financial situations or needs. Before acting on any information provided, you should consider whether the information is suitable for you and your personal circumstances and if necessary, seek appropriate professional advice. All opinions, conclusions, forecasts or recommendations are reasonably held at the time of compilation but are subject to change without notice. Past performance is not an indication of future performance. Go Markets Pty Ltd, ABN 85 081 864 039, AFSL 254963 is a CFD issuer, and trading carries significant risks and is not suitable for everyone. You do not own or have any interest in the rights to the underlying assets. You should consider the appropriateness by reviewing our TMD, FSG, PDS and other CFD legal documents to ensure you understand the risks before you invest in CFDs. These documents are available here.
#SpotGold #SpotSilver #GoldTrading #SilverTrading #SpotWTICrudeOil #WTICrudeOil #SpotBrentCrudeOil #BrentCrudeOil #OilTrading #Commodities #CommoditiesTrading #CommodityMarket #CommodityTradingNext Article
Dicker Data’s year of acquisitions
Dicker Data is an Australian-owned and operated, ASX-listed technology hardware, software and cloud distributor. They were founded in 1978. As a distributor, they sell exclusively to a valued partner base of over 5,500 resellers. Dicker Data distributes a wide portfolio of products from the world’s leading technology vendors. Dicker Data h...
March 2, 2022Read More >Previous Article
NIO’s February delivery numbers are in
NIO Inc. (NIO) reported its latest delivery numbers for February on Tuesday. The Chinese electric vehicle company delivered 6,131 cars last month �...
March 2, 2022Read More >Please share your location to continue.
Check our help guide for more info.

