- Trading
- Trading
- Markets
- Markets
- Products overview
- Forex
- Commodities
- Metals
- Indices
- Shares
- Cryptocurrencies
- Treasuries
- ETFs
- Accounts
- Accounts
- Compare our accounts
- Our spreads
- Funding & withdrawals
- Open CFD account
- Try free demo
- Platforms & tools
- Platforms & tools
- Platforms
- Platforms
- Platforms overview
- GO Markets trading app
- MetaTrader 4
- MetaTrader 5
- cTrader
- cTrader copy trading
- Mobile trading platforms
- GO WebTrader
- Premium trading tools
- Premium trading tools
- Tools overview
- VPS
- Genesis
- Education
- Education
- Resources
- Resources
- News & analysis
- Education hub
- Economic calendar
- Earnings announcements
- Help & support
- Help & support
- About
- About
- About GO Markets
- Our awards
- Sponsorships
- Client support
- Client support
- Contact us
- FAQs
- Quick support
- Holiday trading hours
- Maintenance schedule
- Fraud and scam awareness
- Legal documents
- Trading
- Trading
- Markets
- Markets
- Products overview
- Forex
- Commodities
- Metals
- Indices
- Shares
- Cryptocurrencies
- Treasuries
- ETFs
- Accounts
- Accounts
- Compare our accounts
- Our spreads
- Funding & withdrawals
- Open CFD account
- Try free demo
- Platforms & tools
- Platforms & tools
- Platforms
- Platforms
- Platforms overview
- GO Markets trading app
- MetaTrader 4
- MetaTrader 5
- cTrader
- cTrader copy trading
- Mobile trading platforms
- GO WebTrader
- Premium trading tools
- Premium trading tools
- Tools overview
- VPS
- Genesis
- Education
- Education
- Resources
- Resources
- News & analysis
- Education hub
- Economic calendar
- Earnings announcements
- Help & support
- Help & support
- About
- About
- About GO Markets
- Our awards
- Sponsorships
- Client support
- Client support
- Contact us
- FAQs
- Quick support
- Holiday trading hours
- Maintenance schedule
- Fraud and scam awareness
- Legal documents
- Home
- News & analysis
- Oil, Metals, Soft Commodities
- Natural Gas – Technical Analysis
News & analysisThe United States used 30.28 trillion cubic feet of natural gas in 2021, making them the world’s largest consumer of natural gas. Natural gas consumption in the United States has two seasonal peaks, largely reflecting weather-related fluctuations in energy demand. One of the biggest consumptions of gas is industrial, residential and commercial cooling and heating systems (eia, 2022).
As the world’s largest user of natural gas transitions out of summer, will this change indicate a decrease of their natural gas consumption?
Could the decrease in demand for cooling be reflected on the technical charts?
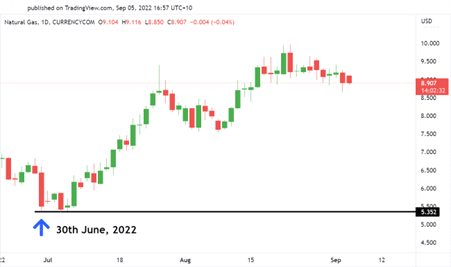
On a daily timeframe, natural gas has been on a steady upward trend since the end of June, in tandem with the beginning of summer in the US (seen on the chart below).

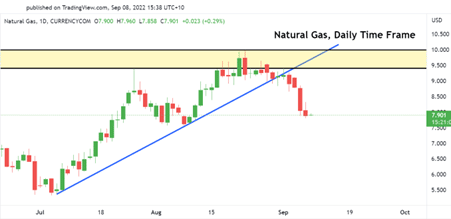
A trendline from the beginning of that trend until now can be drawn, and we can see recently that line has been broken by a daily candlestick, closing below the trendline which can indicate a change in trend for natural gas.

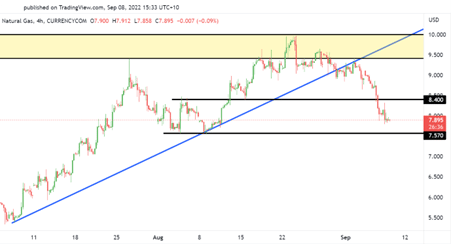
After the strong break below of the trendline followed by multiple bearish daily candlesticks, we can consequently expect further downside movement for natural gas, after breaking through a strong support at $8.4, in all probability with natural gas currently sitting at $7.895 we could see natural gas come down to the next support level around $7.57.

Ready to start trading?
The information provided is of general nature only and does not take into account your personal objectives, financial situations or needs. Before acting on any information provided, you should consider whether the information is suitable for you and your personal circumstances and if necessary, seek appropriate professional advice. All opinions, conclusions, forecasts or recommendations are reasonably held at the time of compilation but are subject to change without notice. Past performance is not an indication of future performance. Go Markets Pty Ltd, ABN 85 081 864 039, AFSL 254963 is a CFD issuer, and trading carries significant risks and is not suitable for everyone. You do not own or have any interest in the rights to the underlying assets. You should consider the appropriateness by reviewing our TMD, FSG, PDS and other CFD legal documents to ensure you understand the risks before you invest in CFDs. These documents are available here.
#SpotGold #SpotSilver #GoldTrading #SilverTrading #SpotWTICrudeOil #WTICrudeOil #SpotBrentCrudeOil #BrentCrudeOil #OilTrading #Commodities #CommoditiesTrading #CommodityMarket #CommodityTradingNext Article
Kroger tops estimates for Q2 – the stock is up
The Kroger Company (KR) released its latest financial results for Q2 on Friday. The American grocery supermarket chain reported revenue of $34.638 billion for the quarter vs. $34.461 billion estimate. Earnings per share also beat analyst estimates at $0.90 per share vs. $0.82 per share expected. "Kroger delivered strong second quarter resu...
September 12, 2022Read More >Previous Article
Oil Price tumbles to 7 month lows as recession fears grow
Brent Crude and West Texas Intermediate Oil both fell to their lowest levels since January as fresh recession fears swept the market. Brent dropped to...
September 8, 2022Read More >Please share your location to continue.
Check our help guide for more info.


