- Trading
- Trading
- Markets
- Markets
- Products overview
- Forex
- Commodities
- Metals
- Indices
- Shares
- Cryptocurrencies
- Treasuries
- ETFs
- Accounts
- Accounts
- Compare our accounts
- Our spreads
- Funding & withdrawals
- Open CFD account
- Try free demo
- Platforms & tools
- Platforms & tools
- Platforms
- Platforms
- Platforms overview
- GO Markets trading app
- MetaTrader 4
- MetaTrader 5
- cTrader
- cTrader copy trading
- Mobile trading platforms
- GO WebTrader
- Premium trading tools
- Premium trading tools
- Tools overview
- VPS
- Genesis
- Education
- Education
- Resources
- Resources
- News & analysis
- Education hub
- Economic calendar
- Earnings announcements
- Help & support
- Help & support
- About
- About
- About GO Markets
- Our awards
- Sponsorships
- Client support
- Client support
- Contact us
- FAQs
- Quick support
- Holiday trading hours
- Maintenance schedule
- Fraud and scam awareness
- Legal documents
- Trading
- Trading
- Markets
- Markets
- Products overview
- Forex
- Commodities
- Metals
- Indices
- Shares
- Cryptocurrencies
- Treasuries
- ETFs
- Accounts
- Accounts
- Compare our accounts
- Our spreads
- Funding & withdrawals
- Open CFD account
- Try free demo
- Platforms & tools
- Platforms & tools
- Platforms
- Platforms
- Platforms overview
- GO Markets trading app
- MetaTrader 4
- MetaTrader 5
- cTrader
- cTrader copy trading
- Mobile trading platforms
- GO WebTrader
- Premium trading tools
- Premium trading tools
- Tools overview
- VPS
- Genesis
- Education
- Education
- Resources
- Resources
- News & analysis
- Education hub
- Economic calendar
- Earnings announcements
- Help & support
- Help & support
- About
- About
- About GO Markets
- Our awards
- Sponsorships
- Client support
- Client support
- Contact us
- FAQs
- Quick support
- Holiday trading hours
- Maintenance schedule
- Fraud and scam awareness
- Legal documents
- Home
- News & analysis
- Articles
- Oil, Metals, Soft Commodities
- Market Analysis 17-21 April 2023 – TH
- Home
- News & analysis
- Articles
- Oil, Metals, Soft Commodities
- Market Analysis 17-21 April 2023 – TH
 News & analysisNews & analysis
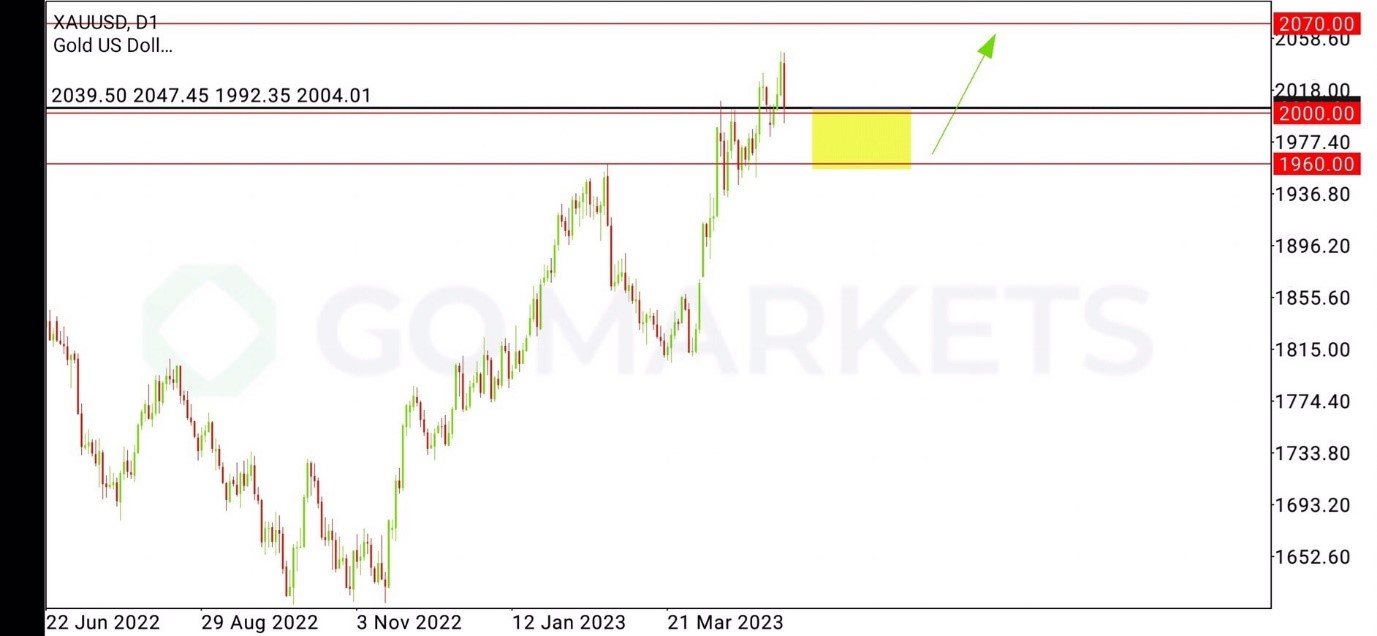
XAUUSD Analysis 17 – 21 April 2023
The gold price outlook is positive in the medium term. As last week’s closing of the buying bar was above the 1960 support or the latest high in price on the Weekly timeframe, it indicates the continued buying momentum that will allow the price of gold to continue. It can rise further to test the 2070 resistance level, which is a key resistance level at the weekly timeframe level and is the highest price level that gold has ever reached in history.
But even so, the price of gold remains negative in the short term. Because the close of the last week’s buying pressure has drawn down as much as half of the candlestick. This indicates weaker buying momentum following last Friday’s sell-off. which may have descended to adjust the base or sideways at the 2000 support level and if the price is moving towards the next support, 1985 and 1976, which are important support levels at the time frame H4 and H1 to watch because if the price cannot go down deeper than the above two support levels The direction of the gold price is likely to continue to rise to test the resistance 2070, in line with the large time frame in the medium term where the price is still Up Trend.
And if the price of gold cannot continue to rise, but there is a breakout of the 1985 and 1976 support levels, it can come down with continuous selling pressure. Daytime support at the 1960 price level or the latest price high in the Weekly timeframe are next targets to watch.

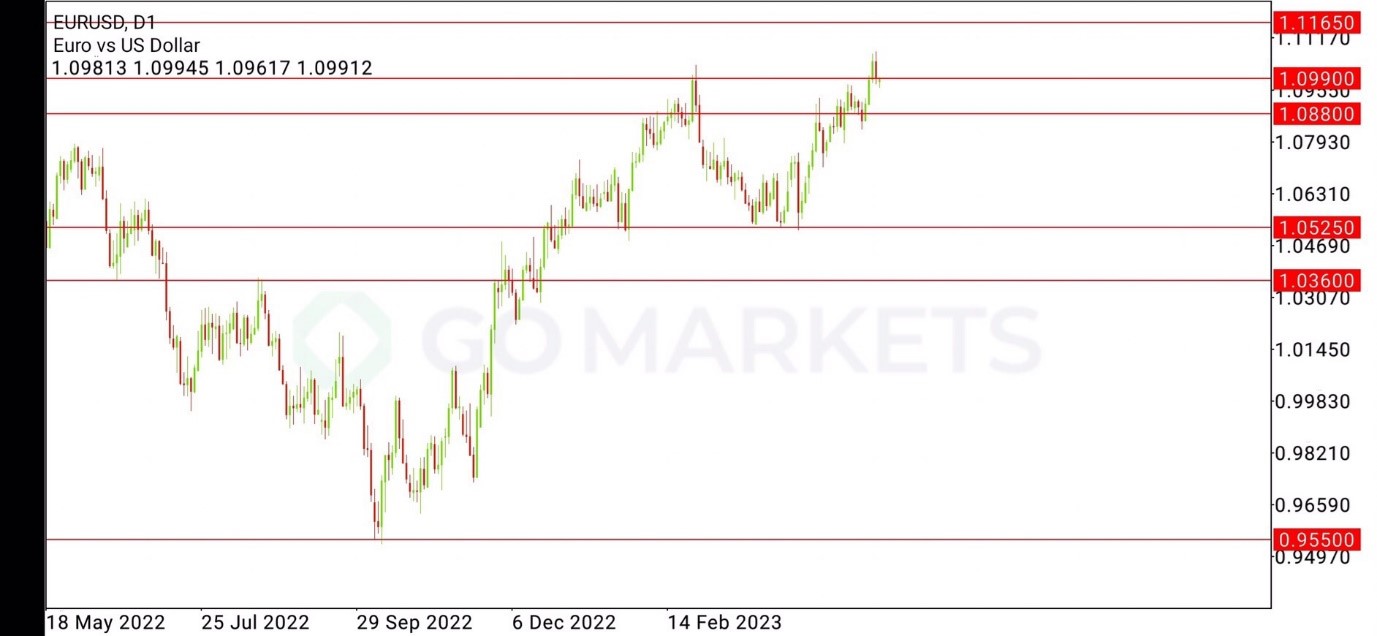
EURUSD Analysis 17 – 21 April 2023
EURUSD Price can be viewed both positively and negatively. As EURUSD is currently hovering around 1.09900, which is the previous high in the Weekly and Daily timeframes, and is starting to lose buying momentum as the weekly candlestick has moved in the past week. guts down (Significantly) as last week’s closing price was lower than last week’s high. After adjusting up to test the latest High before there is a selling pressure down.
Forecasting that price There can be both up and down directions in the medium-term daily timeframe as the loss of buying momentum last week has made the trend or price trend less pronounced. The price is 1.09900, the next target that the price will rise to test is the resistance 1.11650. down to the support area 1.08800.

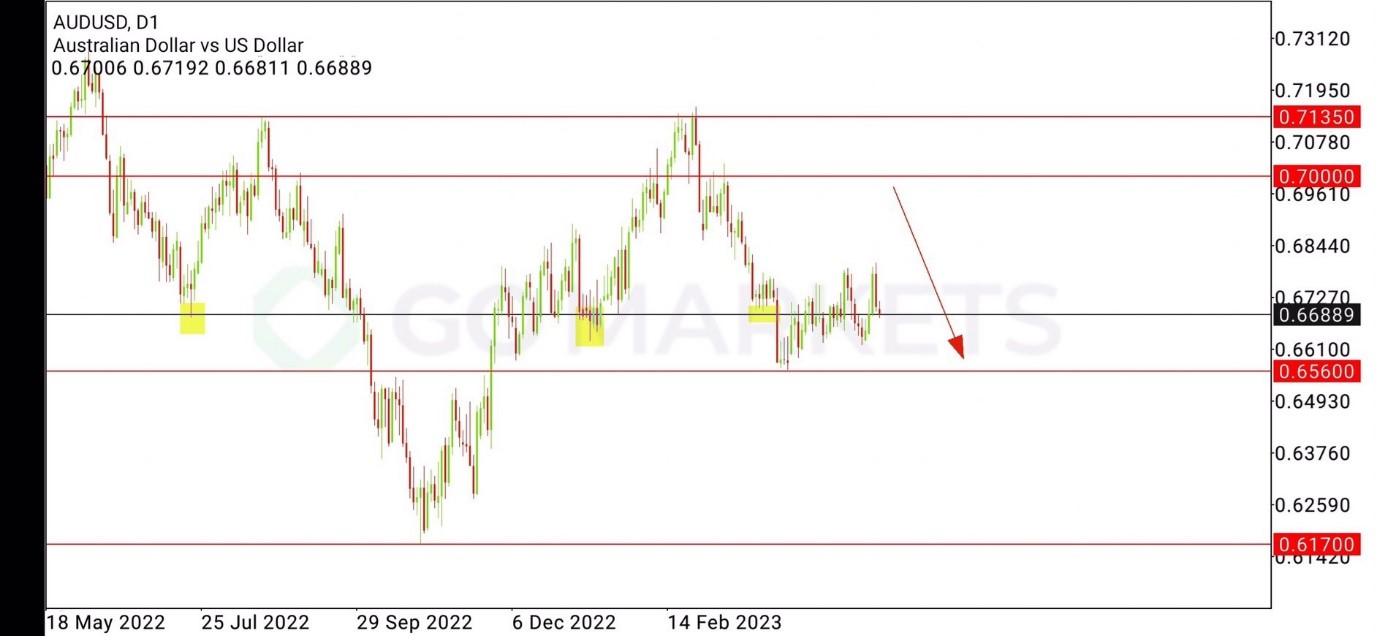
AUDUSD Analysis 17 – 21 April 2023
The AUDUSD is sideways and swings within the 0.67750 resistance and 0.6560 support levels as seen on the H4 timeframe and the Daily timeframe. Up to half of the wicks were dropped, even though it was closed by a buying bar. The buying momentum of the price is not yet clearly seen compared to the selling momentum.
Forecasting that price May have a more negative direction. As the price of AUDUSD continues to be in a downtrend in both the short and medium term. Therefore, a correction to continue downwards is very worth watching, especially the support at 0.6560 on the daily timeframe level, which is expected to be the next target for AUDUSD in the event of a decline. And in case of a rally, it is expected that the price may rise slightly at the resistance area of 0.67750.
Ready to start trading?
The information provided is of general nature only and does not take into account your personal objectives, financial situations or needs. Before acting on any information provided, you should consider whether the information is suitable for you and your personal circumstances and if necessary, seek appropriate professional advice. All opinions, conclusions, forecasts or recommendations are reasonably held at the time of compilation but are subject to change without notice. Past performance is not an indication of future performance. Go Markets Pty Ltd, ABN 85 081 864 039, AFSL 254963 is a CFD issuer, and trading carries significant risks and is not suitable for everyone. You do not own or have any interest in the rights to the underlying assets. You should consider the appropriateness by reviewing our TMD, FSG, PDS and other CFD legal documents to ensure you understand the risks before you invest in CFDs. These documents are available here.
#Forex #ForexAnalysis #ForexBroker #ForexCharts #ForexMarket #ForexNews #ForexSignal #ForexTradingNext Article
Bank of America beats Wall Street expectations, CEO expects a ”mild recession”
Bank of America Corporation (NYSE: BAC) reported the latest financial results for Q1 on Wednesday, beating analyst expectations for both revenue and earnings per share (EPS). Company overview Founded: 1998 (via the merger of BankAmerica & NationsBank) Headquarters: Charlotte, North Carolina, United States Number of branches: 3,900...
April 19, 2023Read More >Previous Article
Charles Schwab posts mixed Q1 results
Charles Schwab Corporation (NYSE: SCHW) announced the latest financial results for the first three months of 2023 ended March 31, before the opening b...
April 18, 2023Read More >Please share your location to continue.
Check our help guide for more info.

