- Trading
- Trading
- Markets
- Markets
- Products overview
- Forex
- Commodities
- Metals
- Indices
- Shares
- Cryptocurrencies
- Treasuries
- ETFs
- Accounts
- Accounts
- Compare our accounts
- Our spreads
- Funding & withdrawals
- Open CFD account
- Try free demo
- Platforms & tools
- Platforms & tools
- Platforms
- Platforms
- Platforms overview
- GO Markets trading app
- MetaTrader 4
- MetaTrader 5
- cTrader
- cTrader copy trading
- Mobile trading platforms
- GO WebTrader
- Premium trading tools
- Premium trading tools
- Tools overview
- VPS
- Genesis
- Education
- Education
- Resources
- Resources
- News & analysis
- Education hub
- Economic calendar
- Earnings announcements
- Help & support
- Help & support
- About
- About
- About GO Markets
- Our awards
- Sponsorships
- Client support
- Client support
- Contact us
- FAQs
- Quick support
- Holiday trading hours
- Maintenance schedule
- Fraud and scam awareness
- Legal documents
- Trading
- Trading
- Markets
- Markets
- Products overview
- Forex
- Commodities
- Metals
- Indices
- Shares
- Cryptocurrencies
- Treasuries
- ETFs
- Accounts
- Accounts
- Compare our accounts
- Our spreads
- Funding & withdrawals
- Open CFD account
- Try free demo
- Platforms & tools
- Platforms & tools
- Platforms
- Platforms
- Platforms overview
- GO Markets trading app
- MetaTrader 4
- MetaTrader 5
- cTrader
- cTrader copy trading
- Mobile trading platforms
- GO WebTrader
- Premium trading tools
- Premium trading tools
- Tools overview
- VPS
- Genesis
- Education
- Education
- Resources
- Resources
- News & analysis
- Education hub
- Economic calendar
- Earnings announcements
- Help & support
- Help & support
- About
- About
- About GO Markets
- Our awards
- Sponsorships
- Client support
- Client support
- Contact us
- FAQs
- Quick support
- Holiday trading hours
- Maintenance schedule
- Fraud and scam awareness
- Legal documents
- Home
- News & analysis
- Oil, Metals, Soft Commodities
- Is the rally in the commodities markets going to continue?
- Home
- News & analysis
- Oil, Metals, Soft Commodities
- Is the rally in the commodities markets going to continue?
 News & analysisNews & analysis
After being under a tremendous amount of pressure over the five past years, commodities, represented by the Bloomberg Commodity Index, finally started to show signs of relief when they rallied by some 11% (measured from close to close) over the past three months.

This may not seem too much, but when you consider that since 1991 only 8% of the times the commodity index has rallied by 11% or more in any three-month period, and the fact that the size of this rally is almost twice the size of average three monthly rallies, then all of a sudden it becomes a meaningful one to watch.

In previous articles, we have discussed why commodities, especially gold and oil have rallied so much, but the current question that traders face is whether this trend is going to continue or has it reached the exhaustion point?
In this article, we will look at history and try to answer the above question from purely price action point of view.
To do this, we’ve looked for any historical returns that matched the current returns (plus or minus 10% variation to allow for random market fluctuations) and got the models to investigate what has happened to each commodity 1, 3 and six months after such events.
The Commodity Index
In total, there have been 15 other cases where the Bloomberg Commodity Index has rallied by around 11% over a three-month period. Out of these, seven happened after the GFC (during the commodity boom), and the rest belong to periods before 2008 through to 1991. The table below shows what’s happened to the commodities each time they rallied by 11% in a three month period.
The Commodity Index performance after an 11% rally in three months

As you can see, an 11% three-month return doesn’t have much of explanatory power for the next 1-3 months as the number of positive and negative case over the next 1-3 months are almost equal. While the next 1-3 months are not clear, trend direction in the next six months is in a much better position. Based on the table below, there is a 77% chance that commodities end up being higher over the next six months.
Gold
For the month ending 29/4/2016, gold was up by 21% compared to the closing price at the end of November 2015. Since 1928, only 5.6% of the times gold has rallied by 21% or more in any five month period. During this period, gold’s average five-month positive return was around 12.6%.
Therefore, the rally from the end of November 2015 to end of April 2016 is significant in both the size and the frequency of gold rallies. The table below shows what’s happened to gold each time it has rallied by almost 19% over a five month period.
Gold’s performance after a 21% rally in five months

Like the commodities index, while the table above doesn’t have much to say about the direction of gold in the next 1-3 months, it suggests however, that over the longer term (August onwards) it may resume its rally.
Oil
As at the end of April 2016, Oil (represented by Brent) was up 39% from the January close. Out of 331 three monthly returns from 1998 up to now, there have only been 12 cases where oil has rallied by 19% or more in any three months. With the average of positive three-month ret
urns being around 14%, the recent rally is rare both in size and frequency. The table below shows what has happened to oil each time it has rallied by almost 39% over a three month period.Oil’s performance after a 39% rally in three months

According to this table, there is a 57% chance that oil keeps on trending higher from May to the end of July. However, this is not a great probability as it’s only slightly better than tossing a coin to predict the future direction of oil. Therefore, I won’t hold my breath on it.
Another concerning point in the short term is the sequence of monthly returns. If Brent manages to finish higher for May, then it would be the fourth consecutive month that oil has posted positive back- to-back returns. Historically, there is only a 40% chance that oil continues trending higher after it’s had four consecutive positive monthly returns. Therefore, in the short term, I am not confident that oil can continue going higher (unless we get some new news about further supply disruptions which is a different story all together).
US Dollar
Since none of the above tables were able to give me a rather confident guidance for the direction of commodities over the next 1-3 months, I turned my attention to the USD index for some clues and this time I found something useful.
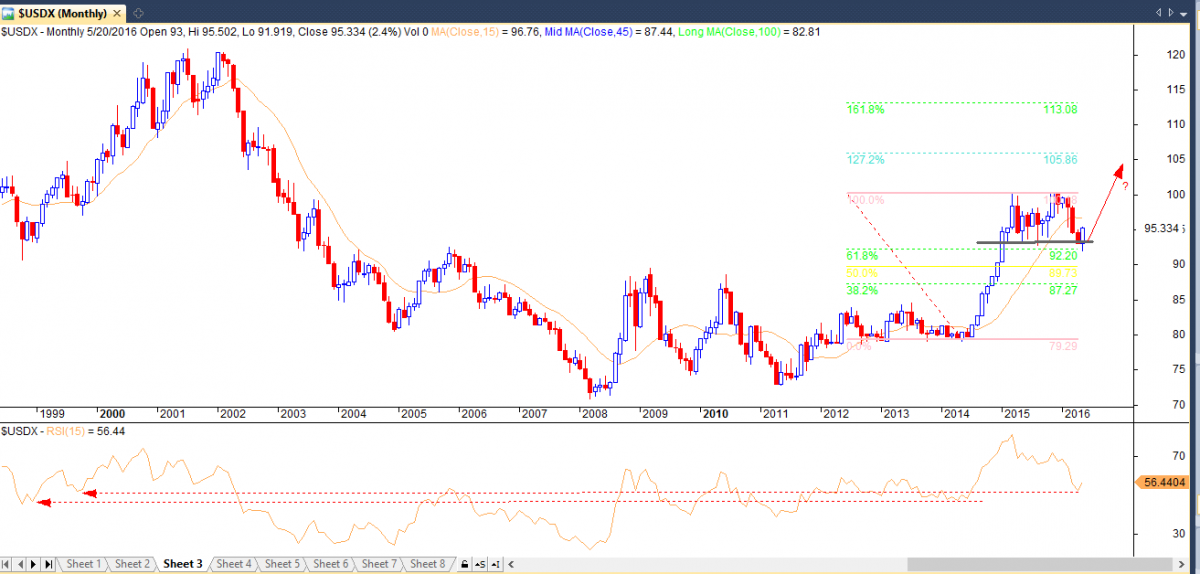
In early May 2013, the USD index briefly dipped below the 93 support level. However, it wasn’t long before the index rapidly rallied back up and went above its bearish trend line. According to the chart below, the last three times USD bounced back from the 93 support line, it easily rallied to 98 and once even touched the 100 area.
Monthly USD index Chart

The current rally also ended a three-month losing streak which began in February. Based on historical data, once the greenback ends a three consecutive losing streak, it usually climbs by an average of 2% in the first month and keeps on appreciating by an average of 3% over the next 2-3 months. The table below suggests there is a 69% chance that the dollar keeps going up in the next 60 days.
USD dollar performance after breaking a three month losing streak

So no firm sign of exhaustion but…
So far in this article, it is reasonable to conclude that while the current rallies in the commodities themselves have not yet reached a specific exhaustion point, due to a 69% chance of stronger dollar in the near term, one should adopt a rather bearish view or at least a conservative view on commodities. Therefore, it may be the time to take some profits or at least not add any more long positions. Based on technicals, should the USD rally, I can see gold dropping to 1206 and then to the 1150 area. In the case of Brent, my first major support is around $43 with a possible extension to $41.
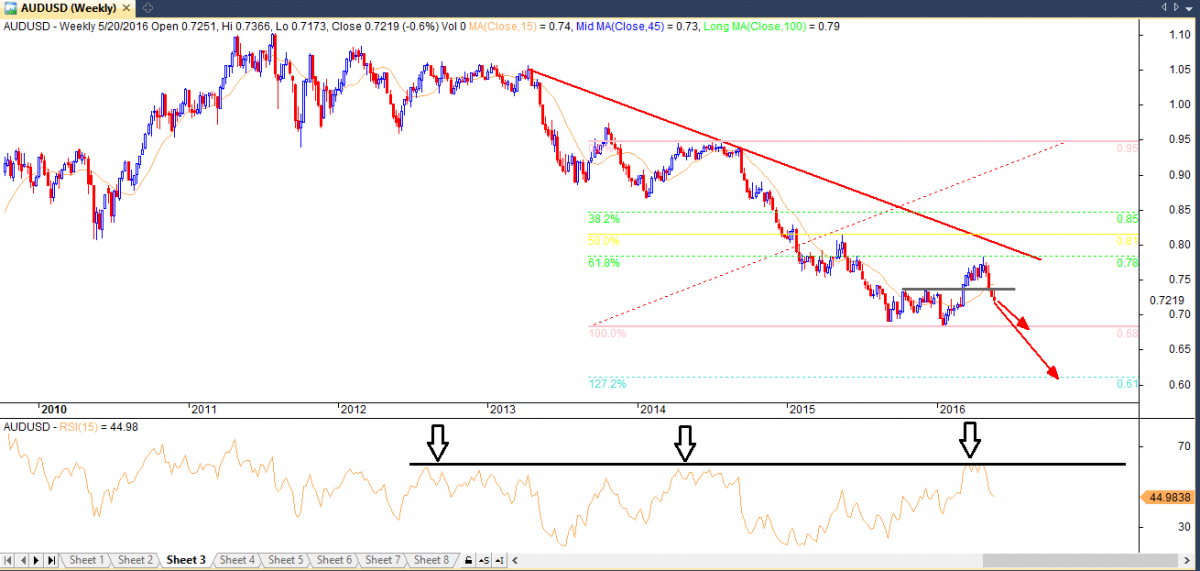
Weekly AUDUSD Chart

Please note that trading Forex and Derivatives carries a high level of risk, including the risk of losing substantially more than your initial investment. Also, you do not own or have any rights to the underlying assets. You should only trade if you can afford to carry these risks. Our offer is not designed to alter or modify any individual’s risk preference or encourage individuals to trade in a manner inconsistent with their own trading strategies.

Ramin Rouzabadi (CFA, CMT) | Trading Analyst Ramin is a broadly skilled investment analyst with over 13 years of domestic and international market experience in equities and derivatives.
With his financial analysis (CFA) and market technician (CMT) background, Ramin is adept at identifying market opportunities and is experienced in developing statistically sound investment strategies.
Ready to start trading?
The information provided is of general nature only and does not take into account your personal objectives, financial situations or needs. Before acting on any information provided, you should consider whether the information is suitable for you and your personal circumstances and if necessary, seek appropriate professional advice. All opinions, conclusions, forecasts or recommendations are reasonably held at the time of compilation but are subject to change without notice. Past performance is not an indication of future performance. Go Markets Pty Ltd, ABN 85 081 864 039, AFSL 254963 is a CFD issuer, and trading carries significant risks and is not suitable for everyone. You do not own or have any interest in the rights to the underlying assets. You should consider the appropriateness by reviewing our TMD, FSG, PDS and other CFD legal documents to ensure you understand the risks before you invest in CFDs. These documents are available here.
#SpotGold #SpotSilver #GoldTrading #SilverTrading #SpotWTICrudeOil #WTICrudeOil #SpotBrentCrudeOil #BrentCrudeOil #OilTrading #Commodities #CommoditiesTrading #CommodityMarket #CommodityTradingNext Article
Swiss National Bank, Bank of England & Brexit News
Last night the Swiss National Bank and the Bank of England kept rates on hold, which was expected. The CPI data came out worst than expected but no big surprises. We also had the Philly Fed manufacturing index, which was much better than expected at 4.7. As to what was expected at 1.1, so it was a good strong figure. Unemployment came out a bit w...
June 17, 2016Read More >Previous Article
7 Best MetaTrader 4 Tips and Tricks
Discover the key MT4 tips and tricks to make you a power user The MetaTrader 4 (MT4 Platform) is arguably the world’s most popular electronic tradin...
May 29, 2016Read More >Please share your location to continue.
Check our help guide for more info.

