- Trading
- Trading
- Markets
- Markets
- Products overview
- Forex
- Commodities
- Metals
- Indices
- Shares
- Cryptocurrencies
- Treasuries
- ETFs
- Accounts
- Accounts
- Compare our accounts
- Our spreads
- Funding & withdrawals
- Open CFD account
- Try free demo
- Platforms & tools
- Platforms & tools
- Platforms
- Platforms
- Platforms overview
- GO Markets trading app
- MetaTrader 4
- MetaTrader 5
- cTrader
- cTrader copy trading
- Mobile trading platforms
- GO WebTrader
- Premium trading tools
- Premium trading tools
- Tools overview
- VPS
- Genesis
- Education
- Education
- Resources
- Resources
- News & analysis
- Education hub
- Economic calendar
- Earnings announcements
- Help & support
- Help & support
- About
- About
- About GO Markets
- Our awards
- Sponsorships
- Client support
- Client support
- Contact us
- FAQs
- Quick support
- Holiday trading hours
- Maintenance schedule
- Fraud and scam awareness
- Legal documents
- Trading
- Trading
- Markets
- Markets
- Products overview
- Forex
- Commodities
- Metals
- Indices
- Shares
- Cryptocurrencies
- Treasuries
- ETFs
- Accounts
- Accounts
- Compare our accounts
- Our spreads
- Funding & withdrawals
- Open CFD account
- Try free demo
- Platforms & tools
- Platforms & tools
- Platforms
- Platforms
- Platforms overview
- GO Markets trading app
- MetaTrader 4
- MetaTrader 5
- cTrader
- cTrader copy trading
- Mobile trading platforms
- GO WebTrader
- Premium trading tools
- Premium trading tools
- Tools overview
- VPS
- Genesis
- Education
- Education
- Resources
- Resources
- News & analysis
- Education hub
- Economic calendar
- Earnings announcements
- Help & support
- Help & support
- About
- About
- About GO Markets
- Our awards
- Sponsorships
- Client support
- Client support
- Contact us
- FAQs
- Quick support
- Holiday trading hours
- Maintenance schedule
- Fraud and scam awareness
- Legal documents
- Home
- News & analysis
- Forex
- US Dollar Index technical and fundamental analysis
News & analysisUS Dollar Index Fundamental Analysis
A hard-fought tug-of-war between bulls and bears played out on the DXY Index after U.S. inflation data crossed the wires. A knee-jerk reaction caused the greenback to plunge, but eventually it was able to recover and move into positive territory due to higher Treasury yields (DXY +0.10% to 103.41).
However, a bearish USD outlook is held by economists at Bank of America Global Research, who see a mild recession in the USA for this year as fed cuts to begin only in March 2024.
“We expect a mild recession starting mid-2023 and Fed cuts to begin only in March 2024. For 2023, the market expects a much milder recession, with the Fed still hiking rate 1-2 more times before slightly cutting rates in second half of the year.”
“For now, we still hold a bearish USD view for the medium term; 2023 playing out in line with leading indicator historical precedents would increase the upside risk to our bearish USD outlook.”
US Dollar Index Technical Analysis
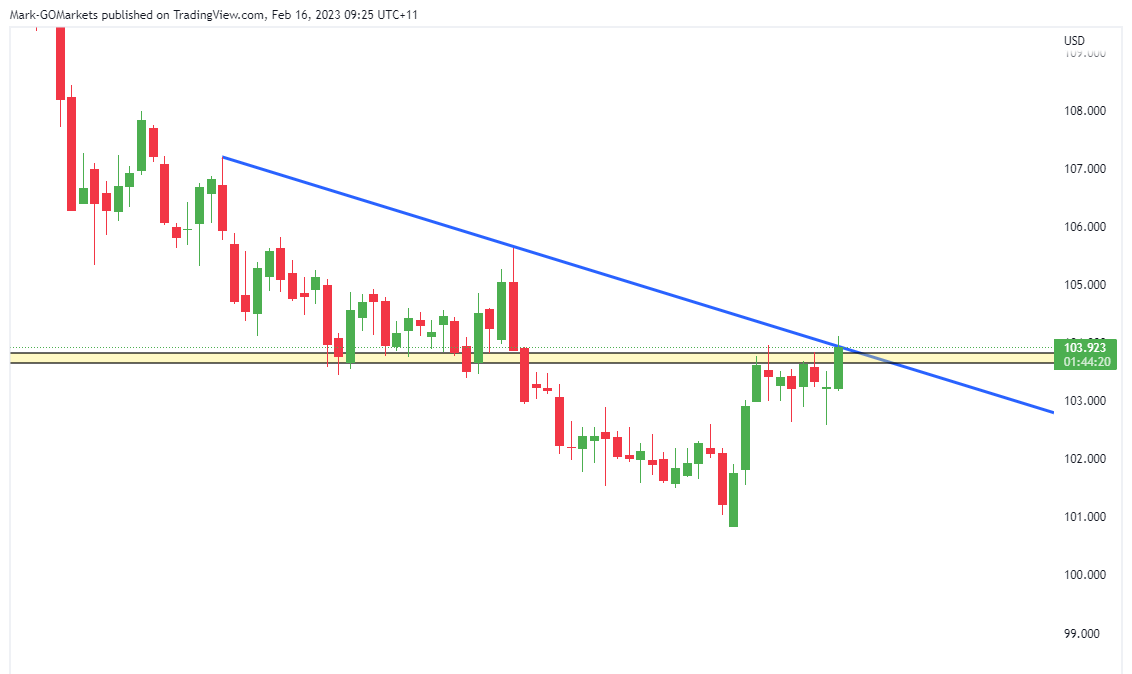
The US Dollar index has been trading in a range between $102.6 to $104 for the last 7 days. At the time of writing, Dollar Index is currently trading at $103.93, which is a major level of resistance where price has fallen significantly from in the past (Jan 2017).
As seen in the photo below, it shows that price has come up to test this trend line that can be clearly seen on the daily time frame, paired with the consolidation, if this daily candlestick closes below $104 there could be a high probability of the US dollar continuing with its higher time frame downtrend.

A break above this trend line however could indicate a move to the upside.
Ready to start trading?
The information provided is of general nature only and does not take into account your personal objectives, financial situations or needs. Before acting on any information provided, you should consider whether the information is suitable for you and your personal circumstances and if necessary, seek appropriate professional advice. All opinions, conclusions, forecasts or recommendations are reasonably held at the time of compilation but are subject to change without notice. Past performance is not an indication of future performance. Go Markets Pty Ltd, ABN 85 081 864 039, AFSL 254963 is a CFD issuer, and trading carries significant risks and is not suitable for everyone. You do not own or have any interest in the rights to the underlying assets. You should consider the appropriateness by reviewing our TMD, FSG, PDS and other CFD legal documents to ensure you understand the risks before you invest in CFDs. These documents are available here.
#Forex #ForexAnalysis #ForexBroker #ForexCharts #ForexMarket #ForexNews #ForexSignal #ForexTradingNext Article
Cisco results announced – the stock gains
US telecommunications giant Cisco Systems Inc. (NASDAQ:CSCO) announced the latest earnings results for the fiscal Q2 ending January 28, 2023, after market close in the US on Wednesday. Cisco beat revenue and earnings per share estimates for the quarter, sending the stock higher. The company reported revenue of $13.592 billion (up by 7% year-o...
February 17, 2023Read More >Previous Article
Barrick Gold Q4 results beat estimates
Barrick Gold Corporation (NYSE:GOLD) released the latest financial results for Q4 2022 on Wednesday. The Canadian mining company beat both revenue ...
February 16, 2023Read More >Please share your location to continue.
Check our help guide for more info.


