- Trading
- Trading
- Markets
- Markets
- Products overview
- Forex
- Commodities
- Metals
- Indices
- Shares
- Cryptocurrencies
- Treasuries
- ETFs
- Accounts
- Accounts
- Compare our accounts
- Our spreads
- Funding & withdrawals
- Open CFD account
- Try free demo
- Platforms & tools
- Platforms & tools
- Platforms
- Platforms
- Platforms overview
- GO Markets trading app
- MetaTrader 4
- MetaTrader 5
- cTrader
- cTrader copy trading
- Mobile trading platforms
- GO WebTrader
- Premium trading tools
- Premium trading tools
- Tools overview
- VPS
- Genesis
- Education
- Education
- Resources
- Resources
- News & analysis
- Education hub
- Economic calendar
- Earnings announcements
- Help & support
- Help & support
- About
- About
- About GO Markets
- Our awards
- Sponsorships
- Client support
- Client support
- Contact us
- FAQs
- Quick support
- Holiday trading hours
- Maintenance schedule
- Fraud and scam awareness
- Legal documents
- Trading
- Trading
- Markets
- Markets
- Products overview
- Forex
- Commodities
- Metals
- Indices
- Shares
- Cryptocurrencies
- Treasuries
- ETFs
- Accounts
- Accounts
- Compare our accounts
- Our spreads
- Funding & withdrawals
- Open CFD account
- Try free demo
- Platforms & tools
- Platforms & tools
- Platforms
- Platforms
- Platforms overview
- GO Markets trading app
- MetaTrader 4
- MetaTrader 5
- cTrader
- cTrader copy trading
- Mobile trading platforms
- GO WebTrader
- Premium trading tools
- Premium trading tools
- Tools overview
- VPS
- Genesis
- Education
- Education
- Resources
- Resources
- News & analysis
- Education hub
- Economic calendar
- Earnings announcements
- Help & support
- Help & support
- About
- About
- About GO Markets
- Our awards
- Sponsorships
- Client support
- Client support
- Contact us
- FAQs
- Quick support
- Holiday trading hours
- Maintenance schedule
- Fraud and scam awareness
- Legal documents
- Home
- News & analysis
- Articles
- Forex
- Market Analysis 24-28 April 2023
News & analysis
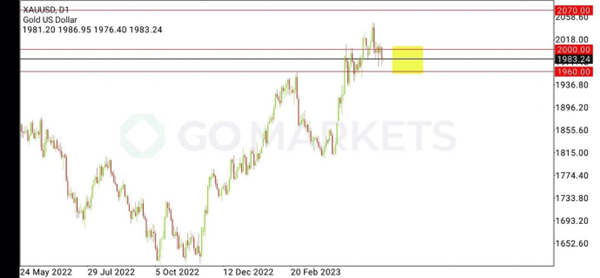
XAUUSD Analysis 24 – 28 April 2023
The gold price outlook is positive in the medium term. Although the close of last week’s sell pressure bar indicates a loss of buying momentum. But the price is still above the 1960 support or the last high of the price in the Weekly time frame, which is very likely that the price will continue to swing or settle down between the 1960 support and the 2000 resistance, which can be adjusted. It can rise further to test the 2070 resistance, which is a key resistance at the weekly timeframe level and is the highest price that gold has ever reached in history.
Predicting the price of gold, the price will swing between the 1960 support and the 2000 resistance to either sideways or consolidate at the above price range. If there is an adjustment to the resistance that is worth watching, 2000 and 2012, respectively, but if there is an adjustment to the 1976 and 1960 support levels, it is the support that should be followed. and after passing through this April Gold price direction will be clearer.

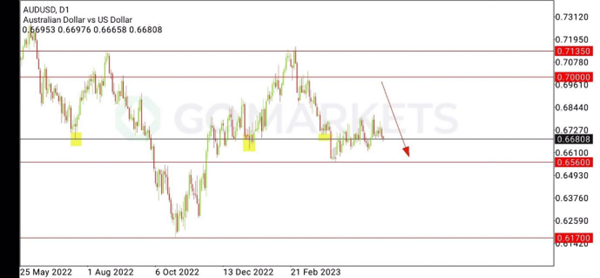
AUDUSD Analysis 24 – 28 April 2023
The AUDUSD is sideways and swings within the 0.67750 resistance and 0.6560 support levels as seen on the H4 timeframe and the Daily timeframe. It is a pin bar that clearly indicates selling momentum. The buying momentum of the price is not yet clearly seen compared to the selling momentum.
Forecasting that price may have a more negative direction. As the price of AUDUSD continues to be in a downtrend in both the short and medium term. Therefore, a correction to continue downwards is very worth watching, especially the support 0.6560 on the H4 timeframe and the Daily timeframe, which is expected to be the next target for the AUDUSD price in the event of a correction down, and in case of a rally, it is expected that the price may rise slightly at the resistance area of 0.67750.

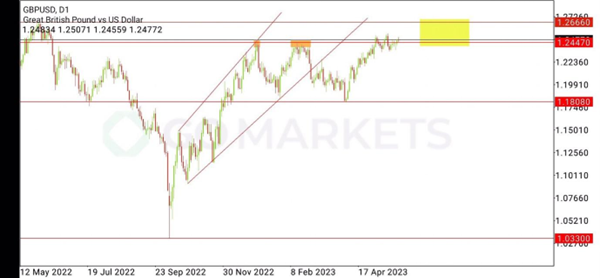
GBPUSD Analysis 24 – 28 April 2023
The GBPUSD trend is currently rebounding and correcting sideways above the key resistance at 1.24470 with continued buying momentum as seen from the weekly timeframe buying candlestick. There is still no clear sell candlestick in the Weekly timeframe, indicating the clarity of the uptrend in both the short and medium term.
Forecasting that the price will likely go sideways correction above the 1.24470 resistance area before rallying to create a new higher high to test the 1.26660 resistance, the next resistance on the daily timeframe level, where the key support is 1.22700. which is a support level at the H4 time frame, which is expected that the price may fall down to test If the price is unable to stand on the resistance 1.24470 and continue to rise.
Ready to start trading?
The information provided is of general nature only and does not take into account your personal objectives, financial situations or needs. Before acting on any information provided, you should consider whether the information is suitable for you and your personal circumstances and if necessary, seek appropriate professional advice. All opinions, conclusions, forecasts or recommendations are reasonably held at the time of compilation but are subject to change without notice. Past performance is not an indication of future performance. Go Markets Pty Ltd, ABN 85 081 864 039, AFSL 254963 is a CFD issuer, and trading carries significant risks and is not suitable for everyone. You do not own or have any interest in the rights to the underlying assets. You should consider the appropriateness by reviewing our TMD, FSG, PDS and other CFD legal documents to ensure you understand the risks before you invest in CFDs. These documents are available here.
#Forex #ForexAnalysis #ForexBroker #ForexCharts #ForexMarket #ForexNews #ForexSignal #ForexTradingNext Article
How to Trade Gold CFDs – Fundamental and Technical strategies
Gold has always been one of the most popular and highly traded markets for CFD traders, especially recently as its price has risen to test its all-time highs. It’s easy to see why, Gold has been a store of value throughout history, and with CFDs it’s possible to take a position in this exciting market, whether you think the price will head up o...
April 26, 2023Read More >Previous Article
Microsoft posts better-than-expected results
US technology giant Microsoft Corporation (NASDAQ: MSFT) released the latest financial results for the quarter ended March 31, 2023, after the market ...
April 26, 2023Read More >Please share your location to continue.
Check our help guide for more info.


