- Trading
- Trading
- Markets
- Markets
- Products overview
- Forex
- Commodities
- Metals
- Indices
- Shares
- Cryptocurrencies
- Treasuries
- ETFs
- Accounts
- Accounts
- Compare our accounts
- Our spreads
- Funding & withdrawals
- Open CFD account
- Try free demo
- Platforms & tools
- Platforms & tools
- Platforms
- Platforms
- Platforms overview
- GO Markets trading app
- MetaTrader 4
- MetaTrader 5
- cTrader
- cTrader copy trading
- Mobile trading platforms
- GO WebTrader
- Premium trading tools
- Premium trading tools
- Tools overview
- VPS
- Genesis
- Education
- Education
- Resources
- Resources
- News & analysis
- Education hub
- Economic calendar
- Earnings announcements
- Help & support
- Help & support
- About
- About
- About GO Markets
- Our awards
- Sponsorships
- Client support
- Client support
- Contact us
- FAQs
- Quick support
- Holiday trading hours
- Maintenance schedule
- Fraud and scam awareness
- Legal documents
- Trading
- Trading
- Markets
- Markets
- Products overview
- Forex
- Commodities
- Metals
- Indices
- Shares
- Cryptocurrencies
- Treasuries
- ETFs
- Accounts
- Accounts
- Compare our accounts
- Our spreads
- Funding & withdrawals
- Open CFD account
- Try free demo
- Platforms & tools
- Platforms & tools
- Platforms
- Platforms
- Platforms overview
- GO Markets trading app
- MetaTrader 4
- MetaTrader 5
- cTrader
- cTrader copy trading
- Mobile trading platforms
- GO WebTrader
- Premium trading tools
- Premium trading tools
- Tools overview
- VPS
- Genesis
- Education
- Education
- Resources
- Resources
- News & analysis
- Education hub
- Economic calendar
- Earnings announcements
- Help & support
- Help & support
- About
- About
- About GO Markets
- Our awards
- Sponsorships
- Client support
- Client support
- Contact us
- FAQs
- Quick support
- Holiday trading hours
- Maintenance schedule
- Fraud and scam awareness
- Legal documents
- Home
- News & analysis
- Forex
- Is there further pain in store for Bitcoin?
News & analysisThe recent price action of the Bitcoin suggests that the leading cryptocurrency may be ready for another sell off. Since last November when the currency peaked it has seen a sharp decline with retracements along the way. With inflation and recessionary pressures prevalent short-term volatility remains high as the market determines how to price the asset. The Jackson Hole symposium is set to begin on Thursday in the USA and may effect the price in the short term if bullish or bearish sentiment comes from the event.
The Chart
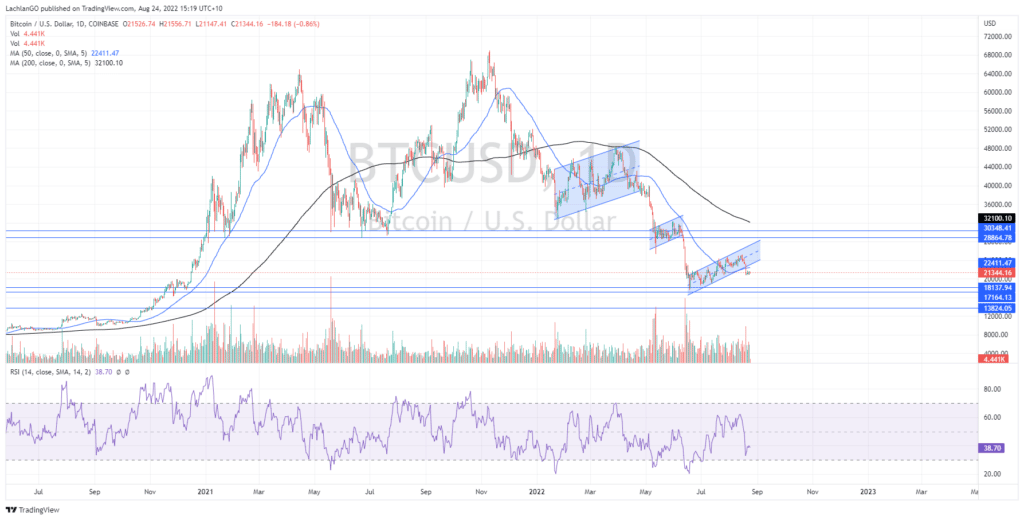
The long-term outlook for Bitcoin is bearish. With constant sell downs and both the 50 Day and 200 day moving average both firmly pushing towards the downside. Furthermore, the price has not been able to sustain any significant rally and has broken through its major support at $30,000 USD.

Recent Price Action
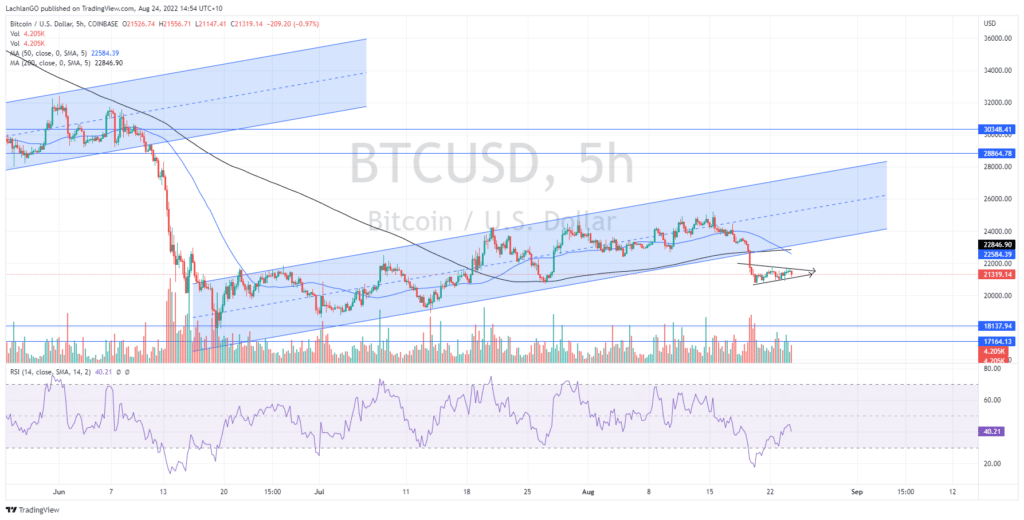
The concern for BTC is that it has sold out of the channel that it had been consolidating in and has therefore rejected the upward move. Similarly, the price has followed this action, twice before with both resulting in sell offs. These patterns appear as traps for bulls because, buyers begin to feel FOMO and then enter long only to be ‘fake out’ as sellers soak up the buying volume and then continue to push the price back down. The RSI also supports more selling as it currently sits at 38 whilst the prior sell offs reached below 20. The RSI also looks to have made a triple top as shown in the chart further indicating that sellers may be ready to drive the price down further.
The concern for buyers is that this current sell off may not be finished. The 5-hour pattern looks to be forming a bear flag/pennant. If the price can break below it may fall to the next support at $17,000/18,000 USD. This pattern is to be expected and is just reflective of sellers taking a breath before they continue to push the price lower. The price has also fallen back below the 50-period moving average indicting short term bearish sentiment. If the short-term target of $ 17,000/18,000 USD cannot hold the next target is the $13,500 USD level.

Ready to start trading?
The information provided is of general nature only and does not take into account your personal objectives, financial situations or needs. Before acting on any information provided, you should consider whether the information is suitable for you and your personal circumstances and if necessary, seek appropriate professional advice. All opinions, conclusions, forecasts or recommendations are reasonably held at the time of compilation but are subject to change without notice. Past performance is not an indication of future performance. Go Markets Pty Ltd, ABN 85 081 864 039, AFSL 254963 is a CFD issuer, and trading carries significant risks and is not suitable for everyone. You do not own or have any interest in the rights to the underlying assets. You should consider the appropriateness by reviewing our TMD, FSG, PDS and other CFD legal documents to ensure you understand the risks before you invest in CFDs. These documents are available here.
#Forex #ForexAnalysis #ForexBroker #ForexCharts #ForexMarket #ForexNews #ForexSignal #ForexTradingNext Article
Results are in – NVIDIA reports
Results are in – NVIDIA reports NVIDIA Corporation (NVDA) announced its second quarter results after the closing bell in the US on Wednesday. The US technology giant reported revenue that exceeded analyst expectations at $6.704 billion for the quarter vs. estimate of $6.699 billion. Earnings per share reported at $0.51 per share, narrowl...
August 25, 2022Read More >Previous Article
XPeng results are here – the stock price is falling
XPeng Inc. (XPEV) reported its unaudited Q2 financial results on Tuesday. The Chinese electric vehicle company reported revenue of $1.11 ...
August 24, 2022Read More >Please share your location to continue.
Check our help guide for more info.


