- Trading
- Trading
- Markets
- Markets
- Accounts
- Accounts
- Platforms & tools
- Platforms & tools
- Platforms
- Platforms
- Premium trading tools
- Premium trading tools
- Education
- Education
- Resources
- Resources
- Help & support
- Help & support
- About
- About
- Client support
- Trading
- Trading
- Markets
- Markets
- Accounts
- Accounts
- Platforms & tools
- Platforms & tools
- Platforms
- Platforms
- Premium trading tools
- Premium trading tools
- Education
- Education
- Resources
- Resources
- Help & support
- Help & support
- About
- About
- Client support
 News & analysis
Deja vu of 2023
26 July 2024Market action and underline breath of the last two and half weeks has been extreme and rather eye opening.
The S&P 500 has made 38 record all time highs in 2024 so far, however since its most recent peak on July 16 it has traded lower ever since. Now we need to put that into perspective, the pullback since its July high is 4.75 percent to date. The pullback that we saw in April was 5.7 per cent , the rally at the end of the April pullback was 14.1 per cent to that July 16 high. And overall the S&P 500 is still up 6.6 per cent year to date.
But what’s really catching our attention is that the pullback in the second half of July looks very much like the pullback that started in July 2023. If we compare the SNP’s year to date performance in 2023 to what we have seen today in 2024 the correlation is surprisingly tight. Have a look at this chart.
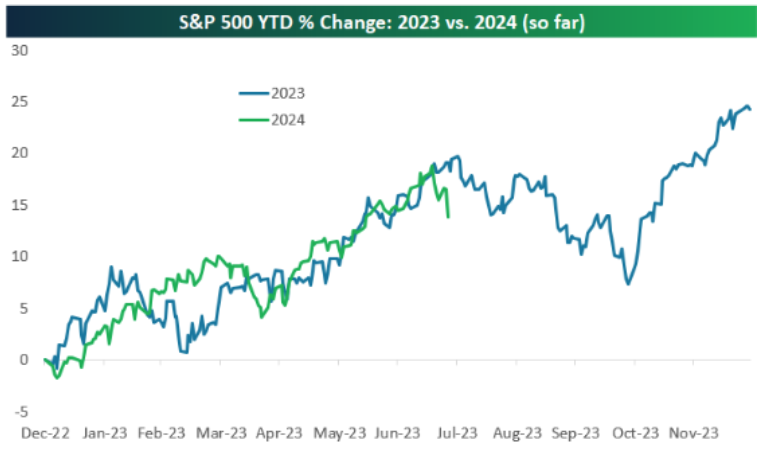
Yes, the path of the market in the first quarter of 2023 was different to what happened this year but by the end of March (2023 and 2024) the S&P was up a similar amount on a year to date basis.
What we can then see is that from the start of the second quarter through to mid-July that correlation is really tight. So the question we’re now asking is are we going to experience déjà vu?
The pullback that began in late July 2023 went all the way through to late October 2023 Started slightly lighter than what we’ve seen this year. But as the price action shows if we follow what happened last year we could be in for a couple of months of high volatility and the Bulls quickly reassessing their current trajectory. It’s going to be interesting because unlike in 2023 where the issues came for monetary policy and the prospect of rate rises or cuts.
2024 has an external factor we only experience every four years and that’s a U.S. presidential election. And what might be a trigger point for the bottom of the market if we are about to experience a multi month pullback would be the November 5 election. Second to that is that all things being equal a rate cut or cuts will have happened by the end of October something that didn’t happen in 2023. What’s hard to equate is the impact one or more cuts will have on indices in particular as according to the market pricing it’s already factored in.
It’s why the current pullback although close to 2023 the deja vu we are experiencing right now is just that deja vu and not something to be factored into your thinking.
What’s going on in FX?
What we are watching very closely on a monetary policy and FX perspective is this coming Wednesday’s CPI read in Australia. Over the last 2 1/2 weeks the AUD has been savaged. So much so that several traders have exited their bullish positions in the Aussie. It’s not hard to see why with the AUD/USD losing some two cents in this. Yes this is down to USD strength on the back of a change in the democratic candidate ,risk increases in markets, and signs of economic reactivity in the world’s largest economy.
But it’s not only the AUD/USD but it’s saying movements of this kind of magnitude news over the last week and a half of intervention by the Bank of Japan has seen the JPY recuperate some of the losses experienced this year. Again using the Aussie dollar as an example AUD/JPY moved from a high of ¥107.56 to as low as ¥100.5 inside 10 days.
This all suggests that at the moment FX is probably ignoring fundamentals and is being caught up in short term external factors. It is why this coming Wednesday’s CPI numbers could be a real turning point in the trading of FX of the last few weeks. Because it should sharpen traders’ minds back to the fundamentals.
As this chart shows, the expectation of a rate rise on August 6 has been as high as 27 percent in fact at one point in the last two months it’s been as high as 46 per cent. This in our opinion has been fully factored out of FX trading in the Aussie over the last couple of weeks.
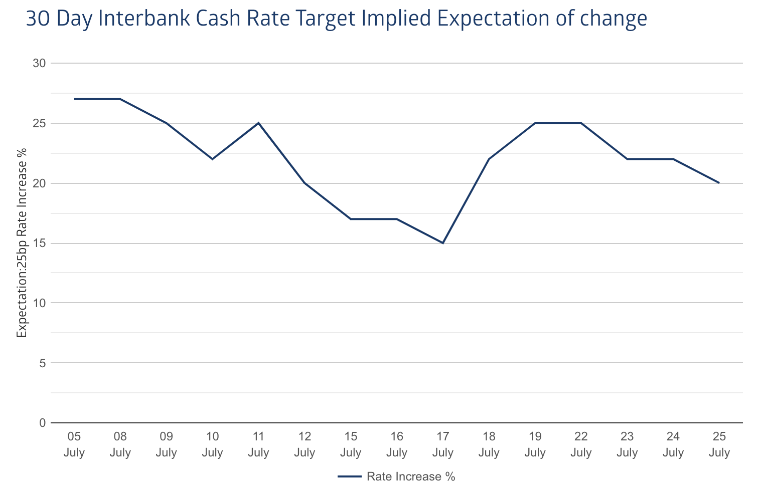
Thus, if Australia’s trimmed mean inflation rate comes in anywhere north of 3.9 per cent year on year. This chart should rapidly change and be pricing in the probability of a rate hike as high as 80per cent for the August 6 meeting.
What this means for FX is that the current sell off in the AUD is probably overdone and will rapidly unwind itself. Those bulls that have been shaken out over the last week and 1/2 will more than likely reinstate positions. Crosses that have been savaged are also likely to face a rapid snapback because from what is currently presented in the data suggests the Aussie is more fairly valued where it was two weeks ago rather than where it is now.
The caveat If however Australia is trimming inflation rate comes in at or below 3.9 per cent. Then the current pricing of the Aussie is probably fair, and the reaction is likely to be negative. All pricing this year in the local currency has been on the premise of an improving China which is yet to materialise and the divergence that’s happening at the RBA. If inflation indeed is showing signs of finally declining in Australia then there will be a reaction to the downside because the probability of a rate increase in 2024 will drop back to almost 0, as there will be no data strong enough to convince the RBA to raise rates again is there a hesitant hawk something we discussed 4 weeks ago.
We will do a full report on the CPI next week and how to trade it leading into the August 6 RBA meeting.
Ready to start trading?
The information provided is of general nature only and does not take into account your personal objectives, financial situations or needs. Before acting on any information provided, you should consider whether the information is suitable for you and your personal circumstances and if necessary, seek appropriate professional advice. All opinions, conclusions, forecasts or recommendations are reasonably held at the time of compilation but are subject to change without notice. Past performance is not an indication of future performance. Go Markets Pty Ltd, ABN 85 081 864 039, AFSL 254963 is a CFD issuer, and trading carries significant risks and is not suitable for everyone. You do not own or have any interest in the rights to the underlying assets. You should consider the appropriateness by reviewing our TMD, FSG, PDS and other CFD legal documents to ensure you understand the risks before you invest in CFDs. These documents are available here.
#Forex #ForexAnalysis #ForexBroker #ForexCharts #ForexMarket #ForexNews #ForexSignal #ForexTradingNext Article
One of two ways: Trading Australia’s CPI data
Australia's second quarter CPI due out on the 31st of July could go one of two ways so let's dive into how it will move and how to trade it. First way - Coming in line or below Currently 24 of the 30 surveyed economists see inflation coming in line or below expectations. That is June quarter CPI coming in at 1% quarter on quarter and 3.8% yea...
July 30, 2024Read More >Previous Article
Do you catch a falling knife?
We all know the market term ‘don't catch a falling knife’. And in the current market conditions why would you? But with indices, the likes of the ...
July 23, 2024Read More >
- Trading
- Trading
- Trading
- Markets
- Markets
- Products overview
- Forex
- Commodities
- Metals
- Indices
- Shares
- Cryptocurrencies
- Treasuries
- ETFs
- Accounts
- Accounts
- Compare our accounts
- Our spreads
- Funding & withdrawals
- Open CFD account
- Try free demo
- Platforms & tools
- Platforms & tools
- Platforms
- Platforms
- Platforms overview
- GO Markets trading app
- MetaTrader 4
- MetaTrader 5
- cTrader
- cTrader copy trading
- Mobile trading platforms
- GO WebTrader
- Premium trading tools
- Premium trading tools
- Tools overview
- VPS
- Genesis
- Education
- Education
- Resources
- Resources
- News & analysis
- Education hub
- Economic calendar
- Earnings announcements
- Help & support
- Help & support
- About
- About
- About GO Markets
- Our awards
- Sponsorships
- Client support