- Trading
- Trading
- Markets
- Markets
- Products overview
- Forex
- Commodities
- Metals
- Indices
- Shares
- Cryptocurrencies
- Treasuries
- ETFs
- Accounts
- Accounts
- Compare our accounts
- Our spreads
- Funding & withdrawals
- Open CFD account
- Try free demo
- Platforms & tools
- Platforms & tools
- Platforms
- Platforms
- Platforms overview
- GO Markets trading app
- MetaTrader 4
- MetaTrader 5
- cTrader
- cTrader copy trading
- Mobile trading platforms
- GO WebTrader
- Premium trading tools
- Premium trading tools
- Tools overview
- VPS
- Genesis
- Education
- Education
- Resources
- Resources
- News & analysis
- Education hub
- Economic calendar
- Earnings announcements
- Help & support
- Help & support
- About
- About
- About GO Markets
- Our awards
- Sponsorships
- Client support
- Client support
- Contact us
- FAQs
- Quick support
- Holiday trading hours
- Maintenance schedule
- Fraud and scam awareness
- Legal documents
- Trading
- Trading
- Markets
- Markets
- Products overview
- Forex
- Commodities
- Metals
- Indices
- Shares
- Cryptocurrencies
- Treasuries
- ETFs
- Accounts
- Accounts
- Compare our accounts
- Our spreads
- Funding & withdrawals
- Open CFD account
- Try free demo
- Platforms & tools
- Platforms & tools
- Platforms
- Platforms
- Platforms overview
- GO Markets trading app
- MetaTrader 4
- MetaTrader 5
- cTrader
- cTrader copy trading
- Mobile trading platforms
- GO WebTrader
- Premium trading tools
- Premium trading tools
- Tools overview
- VPS
- Genesis
- Education
- Education
- Resources
- Resources
- News & analysis
- Education hub
- Economic calendar
- Earnings announcements
- Help & support
- Help & support
- About
- About
- About GO Markets
- Our awards
- Sponsorships
- Client support
- Client support
- Contact us
- FAQs
- Quick support
- Holiday trading hours
- Maintenance schedule
- Fraud and scam awareness
- Legal documents
- Home
- News & analysis
- Articles
- Forex
- Market Analysis 8-12 May 2023
News & analysis
XAUUSD Analysis 8 – 12 May 2023
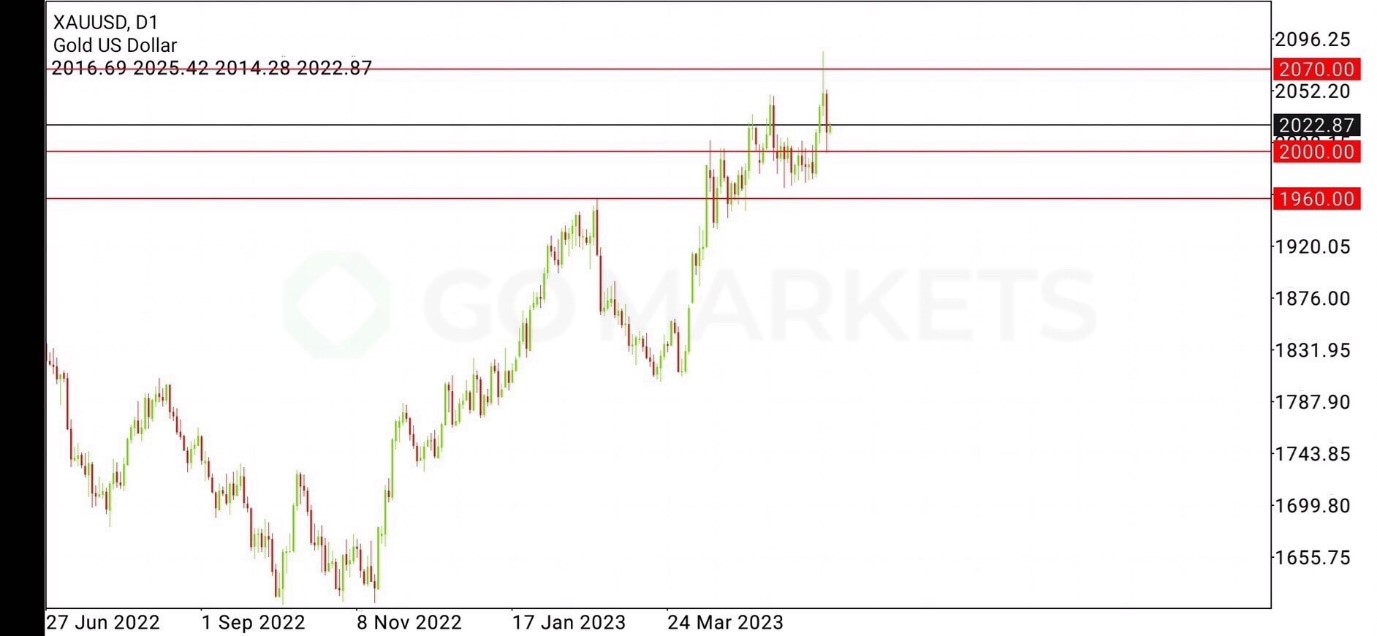
The gold price outlook is positive in the medium term. Although last week’s closing of the buying pressure bar would indicate a loss of buying momentum due to the weekly selloff. But the price is still moving above the 2000 support, it is very likely that the price will continue to move above the 2000 level and there is a chance to rise further to test the 2070 resistance which is a key resistance level. Weekly time frame and the price line that gold used to make the most in history.
Forecasting the price of gold In the short term, the price may rise to test the resistance 2070 as the current price has not broken the support 2000 and there is also buying pressure to push the price up. But if there is a downward adjustment, the 2000 support is an important support that should be monitored closely as it is the price that broke out last week.
GBPUSD Analysis 8 – 12 May 2023
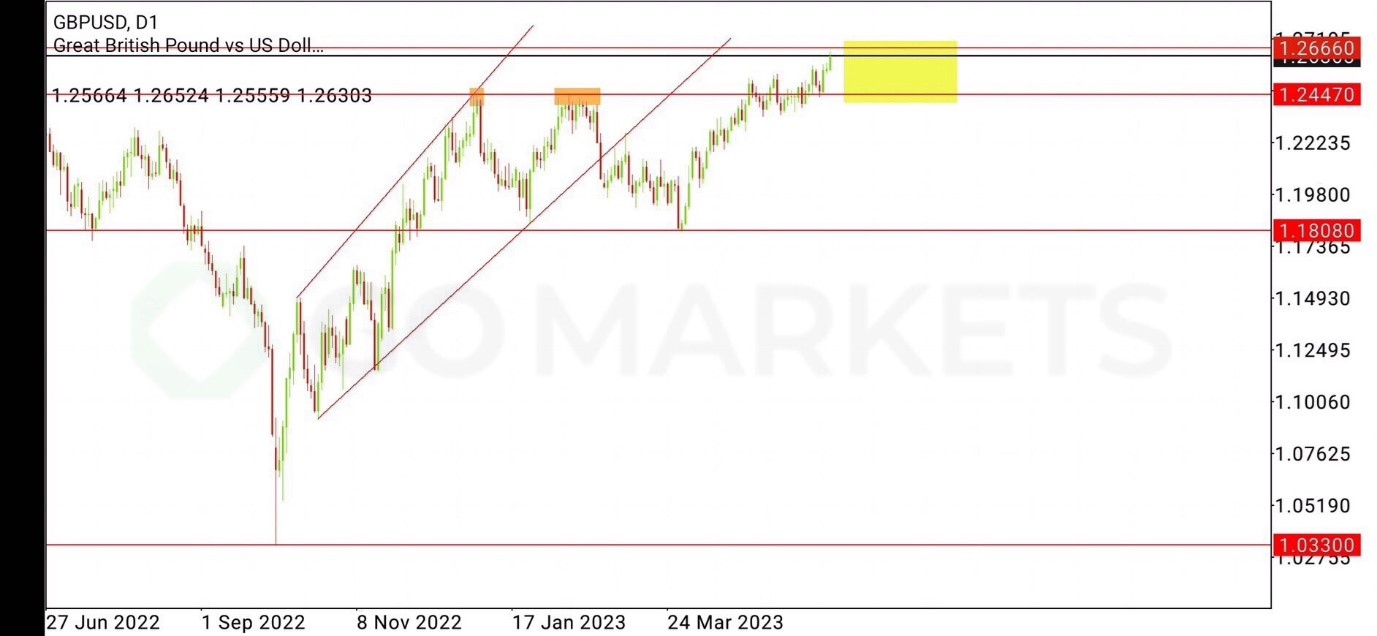
The GBPUSD outlook is bullish in the medium term. At present, the price has risen to test and corrected sideways at the key resistance zone where it formed a Double Top pattern on the daily timeframe 1.24470 with strong buying momentum continuing. When looking at the buy candlestick in the Weekly time frame before continuing to rise to the resistance of 1.26660, but not yet and the price still does not show a strong selling candle to be seen clearly. Indicates the clarity of the uptrend in both short and medium term as the price can finally break out to stand on the resistance 1.24470.
Forecasting that price There is a very high probability that the price will move within the cap between the support 1.24470 (where the price breaks up) and the resistance 1.26660, which is the next resistance at the daily time frame level in order to create a new high at Higher, where the key support is 1.24470, which is the support level at the H4 and Daily timeframes, which are expected to pull the price down to test. If the price is unable to stand on the resistance 1.26660 and continue to rise.

EURUSD Analysis 8 – 12 May 2023
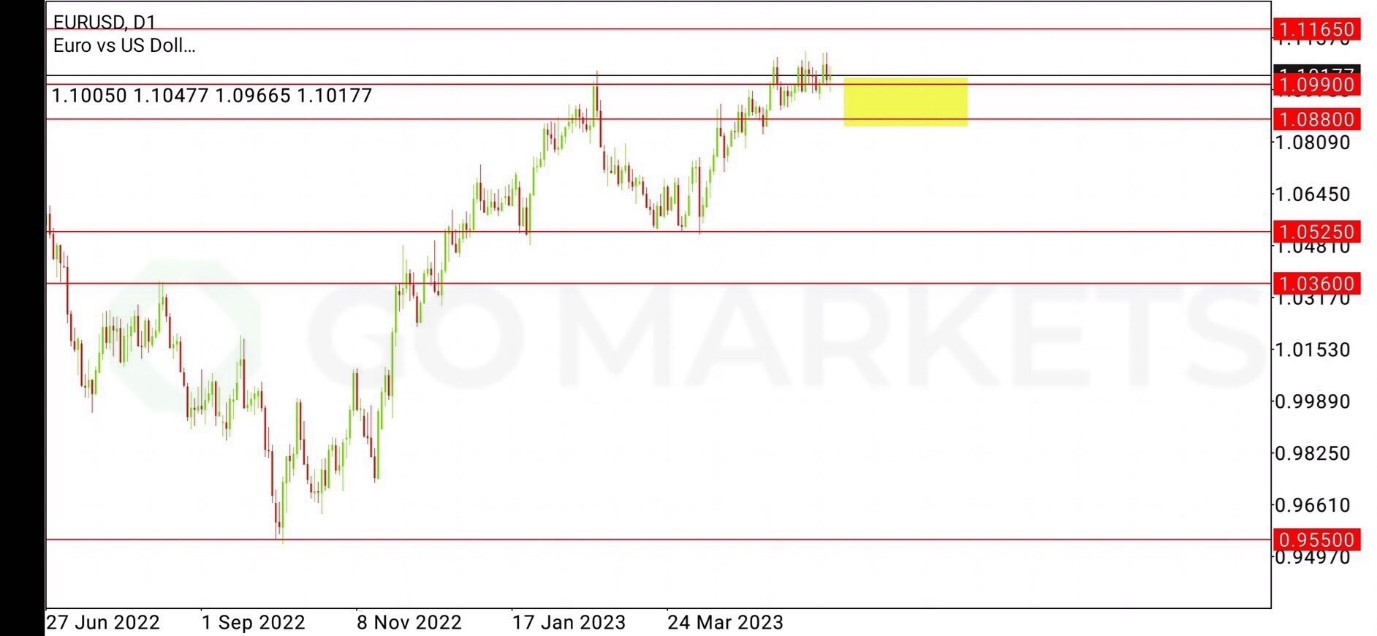
EURUSD Price can be viewed both positively and negatively. As EURUSD is currently sideways around 1.09900, which was the previous high on the Weekly and Daily timeframes and is starting to lose buying momentum based on the weekly buy candlestick. Past closes as Doji bars (significantly) indicate market hesitation. After adjusting up to test the latest High before having selling pressure down during the week.
Forecasting that price There may be both an upward and downward direction in the short and medium term, like the Daily time frame, as the loss of buying momentum last week after trying to create a new higher high around the 1. 10900 price line has made the trend. Or the trend of the price is less clear. If EURUSD manages to sideways and stay on the 1.09900 level without breaking out first, the next target for price to test is resistance 1.11650 in order to create a new high higher than the previous high, but If the pair fails to hold on to the 1.09900 level and then rises to the 1.11650 resistance level, it is possible that it will test the 1.08800 support area.
Ready to start trading?
The information provided is of general nature only and does not take into account your personal objectives, financial situations or needs. Before acting on any information provided, you should consider whether the information is suitable for you and your personal circumstances and if necessary, seek appropriate professional advice. All opinions, conclusions, forecasts or recommendations are reasonably held at the time of compilation but are subject to change without notice. Past performance is not an indication of future performance. Go Markets Pty Ltd, ABN 85 081 864 039, AFSL 254963 is a CFD issuer, and trading carries significant risks and is not suitable for everyone. You do not own or have any interest in the rights to the underlying assets. You should consider the appropriateness by reviewing our TMD, FSG, PDS and other CFD legal documents to ensure you understand the risks before you invest in CFDs. These documents are available here.
#Forex #ForexAnalysis #ForexBroker #ForexCharts #ForexMarket #ForexNews #ForexSignal #ForexTradingNext Article
Crude Oil Trading with CFD’s – how to speculate on black gold
Crude Oil has always been one of the most popular and highly traded markets for CFD traders whether it is WTI or Brent, especially recently as geopolitical and economic forces have seen its price fluctuate from extreme lows to extreme highs. It’s easy to see why, Oil is a bellwether for the health of the global market, oil greases the wheels of g...
May 9, 2023Read More >Previous Article
ECB hikes rates to 3.75%
Following the lead of the US Federal Reserve, the European Central Bank (ECB) announced its decision to hike rates by 25 basis points, taking interest...
May 5, 2023Read More >Please share your location to continue.
Check our help guide for more info.


